Unlock a world of possibilities! Login now and discover the exclusive benefits awaiting you.
- Qlik Community
- :
- Forums
- :
- Analytics
- :
- App Development
- :
- Re: Estados Alternos/ Alternate States-Qlik Sense
- Subscribe to RSS Feed
- Mark Topic as New
- Mark Topic as Read
- Float this Topic for Current User
- Bookmark
- Subscribe
- Mute
- Printer Friendly Page
- Mark as New
- Bookmark
- Subscribe
- Mute
- Subscribe to RSS Feed
- Permalink
- Report Inappropriate Content
Estados Alternos/ Alternate States-Qlik Sense
Hello everybody!!
I will write this post in both English and Spanish in order more people to be able to give me a better solution
I have designed a dashboard in Qlik Sense. I've got a problem in one of the sheets using filters and charts. I'd like to get to use a particular filter to not affect a particular chart in the same sheet as happens with alternate states in QlikView. There are extensions in QlikBranch which can help me in my goal. Nevertheless, those extensions do not show the filters I have selected in the up part where we see the filters selection area. Even, I'd like to avoid using extensions.
Therefore, I'd like to know if there is a way to do that using an expression, for instance. If anyone can help me on that, I'd be grateful!!!
Thanks so much
Regards,
Ainhoa
--------------------------------------------------------------------------------------------------------------------------------------------------
Tengo un cuadro de mandos en Qlik Sense. Tengo un problema en una de las pestañas con los filtros y gráficos. Quiero conseguir que uno de los filtros no afecte a un gráfico en concreto de la misma pestaña como sucede con los estados alternos en QlikView. Existen extensiones en Qlik Branch que tienen esta funcionalidad. No obstante, no muestra los filtros que han sido seleccionados en la parte de arriba de filtros seleccionados y me gustaría evitar de todas formas el uso de extensiones.
Querría saber si existe alguna forma de conseguir esto usando expresiones, por ejemplo. Si alguien sabe alguna forma de hacerlo, y me dice, estaría muy agradecida!!!
Muchas gracias
Saludos,
Ainhoa
Accepted Solutions
- Mark as New
- Bookmark
- Subscribe
- Mute
- Subscribe to RSS Feed
- Permalink
- Report Inappropriate Content
Hi,
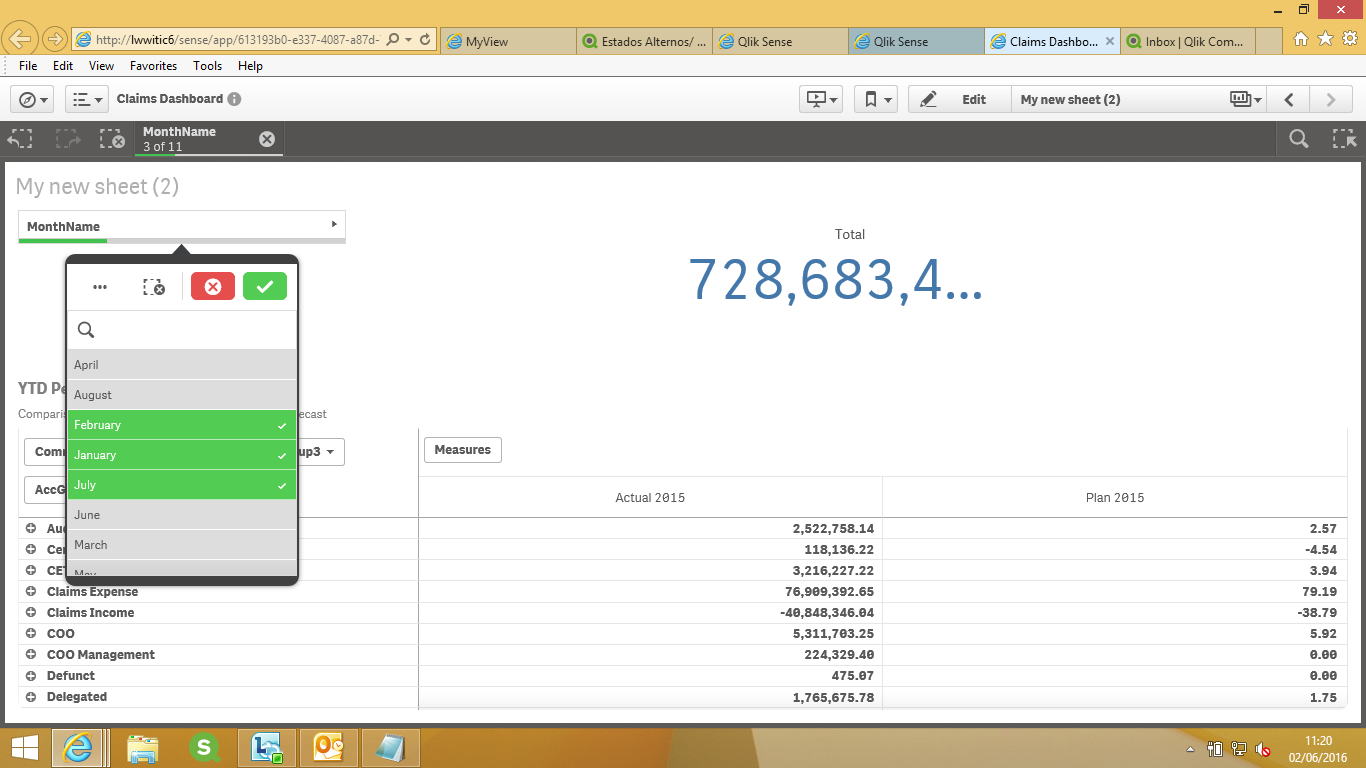
Please find a screen shot of my sample dashboard where I have Month name filter One KPI and on chart and even though I select any month the values don't change screen shot below:

The expressions I have used are for KPI: sum( {<MonthName = {*}>}SumOfBudget_Amount )
and for the expressions in the Pivot table also for the 2 measures I have used MonthName = {*}..
The idea is whichever filter you want not to do any action you need to include in all the charts and for all the measures..
Thanks
- Mark as New
- Bookmark
- Subscribe
- Mute
- Subscribe to RSS Feed
- Permalink
- Report Inappropriate Content
Hi,
Please find a screen shot of my sample dashboard where I have Month name filter One KPI and on chart and even though I select any month the values don't change screen shot below:

The expressions I have used are for KPI: sum( {<MonthName = {*}>}SumOfBudget_Amount )
and for the expressions in the Pivot table also for the 2 measures I have used MonthName = {*}..
The idea is whichever filter you want not to do any action you need to include in all the charts and for all the measures..
Thanks
- Mark as New
- Bookmark
- Subscribe
- Mute
- Subscribe to RSS Feed
- Permalink
- Report Inappropriate Content
Thanks for your help! it was useful! ![]()
- Mark as New
- Bookmark
- Subscribe
- Mute
- Subscribe to RSS Feed
- Permalink
- Report Inappropriate Content
If your question is now answered, please flag the answer as Correct Answer.
If not, please make clear (in English) what part of this topic you like to get (more) help with ![]() .
.