Unlock a world of possibilities! Login now and discover the exclusive benefits awaiting you.
- Qlik Community
- :
- Forums
- :
- Analytics & AI
- :
- Products & Topics
- :
- App Development
- :
- Line Chart for Rolling Time Period
- Subscribe to RSS Feed
- Mark Topic as New
- Mark Topic as Read
- Float this Topic for Current User
- Bookmark
- Subscribe
- Mute
- Printer Friendly Page
- Mark as New
- Bookmark
- Subscribe
- Mute
- Subscribe to RSS Feed
- Permalink
- Report Inappropriate Content
Line Chart for Rolling Time Period
Hi All,
I have a plotted a line chart for the % of 3 types of products A,B and C for the past months in QlikSense:
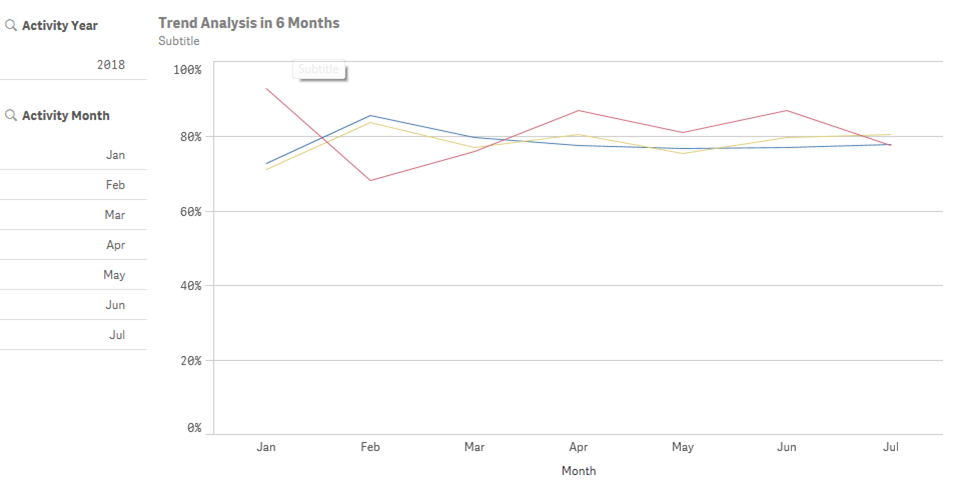
I have few questions when building this chart:
1) Is it possible to show the month in "MMM - YY" format? My original field is a data field and I have used =Month([Activity Date]) as dimension. How can I change the label of my chart? I have tried =Date(Month([Activity Date]),'MMM-YY'), but it is not working...strange values come up. FYI, my activity date is a calculated field by subtracting 1 month from another field that is in date format.
2) As you can see from the title of the chart, it is supposed to be a chart showing rolling past 6 months data only. I want to allow users to choose the activity month from the filter on left hand side. When nothing is selected for the activity month, I would like to show all months as the trend. If a particular month is selected, say 2018 Jun, then I want the chart to show only from 2018 Jan to Jun data. If more than 1 month is selected, say 2018 May & Jun are both selected, I want the chart to show past 6 months counting backward from May (the earliest month in the selection), i.e. 2017 Dec - 2018 May. If possible, I want to change the filter on left hand side to Year Month format as well. Currently I have no idea what should be the right expression to use here.
3) Silly question, is it possible to add a subtitle in QlikSense with 2 lines? E.g.:
Subtitle 1st line
Subtitle 2nd line
I tried chr(13) or chr (10), both not working in QlikSense.
It is okay if you could not answer all of my questions, I would be very appreciated only if you could answer 1/2 of them. Thanks in advance for your time looking into my questions and your help.
- « Previous Replies
-
- 1
- 2
- Next Replies »
- Mark as New
- Bookmark
- Subscribe
- Mute
- Subscribe to RSS Feed
- Permalink
- Report Inappropriate Content
Hi, Janice. Did you try that way?)
- « Previous Replies
-
- 1
- 2
- Next Replies »