Unlock a world of possibilities! Login now and discover the exclusive benefits awaiting you.
- Qlik Community
- :
- Forums
- :
- Analytics
- :
- Topics
- :
- App Development
- :
- Re: Line chart for past three months based on date...
- Subscribe to RSS Feed
- Mark Topic as New
- Mark Topic as Read
- Float this Topic for Current User
- Bookmark
- Subscribe
- Mute
- Printer Friendly Page
- Mark as New
- Bookmark
- Subscribe
- Mute
- Subscribe to RSS Feed
- Permalink
- Report Inappropriate Content
Line chart for past three months based on date selected in filter
Hello Gurus,
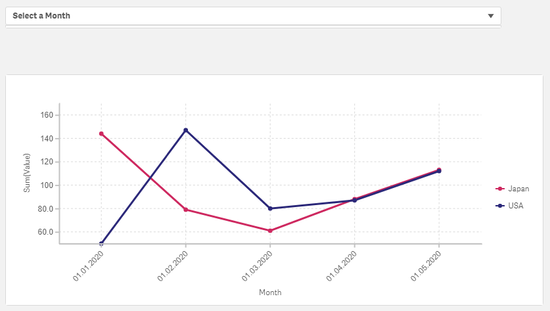
I have some requirement in my Qlik app. I have below dataset to work with;
| Month | Country | Value |
| 01-01-2020 | USA | 50 |
| 01-01-2020 | India | 137 |
| 01-01-2020 | China | 118 |
| 01-01-2020 | Austria | 51 |
| 01-01-2020 | Japan | 144 |
| 01-02-2020 | USA | 147 |
| 01-02-2020 | India | 61 |
| 01-02-2020 | China | 70 |
| 01-02-2020 | Austria | 93 |
| 01-02-2020 | Japan | 79 |
| 01-03-2020 | USA | 80 |
| 01-03-2020 | India | 99 |
| 01-03-2020 | China | 102 |
| 01-03-2020 | Austria | 122 |
| 01-03-2020 | Japan | 61 |
| 01-04-2020 | USA | 87 |
| 01-04-2020 | India | 51 |
| 01-04-2020 | China | 67 |
| 01-04-2020 | Austria | 76 |
| 01-04-2020 | Japan | 88 |
| 01-05-2020 | USA | 112 |
| 01-05-2020 | India | 102 |
| 01-05-2020 | China | 108 |
| 01-05-2020 | Austria | 94 |
| 01-05-2020 | Japan | 113 |
Now I want to see a 3 month trend for Top 2 countries in line chart. To get top 2 countries I am using mentioned expression;
=aggr(if(rank(sum(Value))<3,Country),Country)
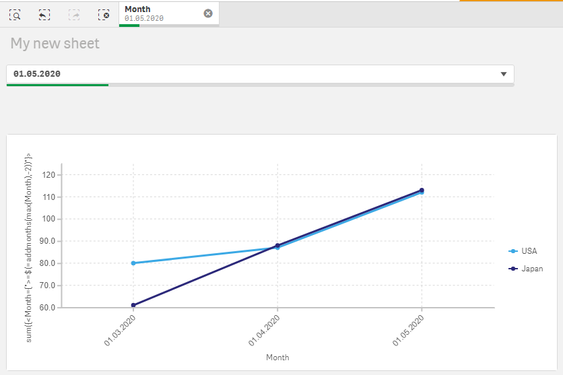
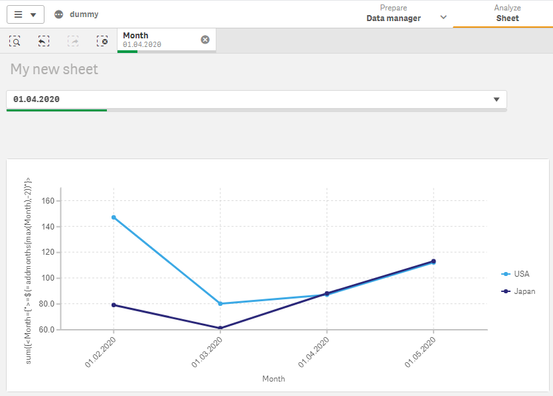
But I am not able to figure out on how to get the trend for only past three months from the date selected in filter. eg. If I select '01-05-2020' in filter the graph should show only the months of '01-05-2020','01-04-2020' and '01-03-2020'. Similarly if I select '01-04-2020' in the filter, the graph should show only the months of '01-04-2020', '01-03-2020' and '01-02-2020'
Can anyone please help me with this? Some assistance here would be highly appreciated!
- Mark as New
- Bookmark
- Subscribe
- Mute
- Subscribe to RSS Feed
- Permalink
- Report Inappropriate Content
hi
try this expression :
sum({<Month={">=$(=addmonths(max(Month),-2))"}>}Value)- Mark as New
- Bookmark
- Subscribe
- Mute
- Subscribe to RSS Feed
- Permalink
- Report Inappropriate Content
Hello @lironbaram , Thank you for the expression. But there is a small issue with this, it works absolutely fine when Max date (01-05-2020) is selected.
But if I select '01-04-2020', the graph shows trend for four months instead of three. Ideally '01-05-2020' should be eliminated from the trend since it comes after '01-04-2020'. The ideal result I want to see here is past 3 months trend only from the selected month.
- Mark as New
- Bookmark
- Subscribe
- Mute
- Subscribe to RSS Feed
- Permalink
- Report Inappropriate Content
HI @Saurabh07
Try with below
sum({<Month={">=$(=addmonths(max(Month),-2))<=$(=addmonths(max(Month),0))"}>}Value)
Please close the thread by marking correct answer & give likes if you like the post.
- Mark as New
- Bookmark
- Subscribe
- Mute
- Subscribe to RSS Feed
- Permalink
- Report Inappropriate Content
@MayilVahanan Many thanks. This has almost worked except for one more condition. Can you also help me figure out on how do I accommodate the state in my expression for Date filter. eg. If I create an alternate state [Current] and apply it to the filter, then this expression wont work. It would be a great help if you can help me resolve this issue?
- Mark as New
- Bookmark
- Subscribe
- Mute
- Subscribe to RSS Feed
- Permalink
- Report Inappropriate Content
HI @Saurabh07
Try like below.
sum({Current<Month={">=$(=addmonths(max({Current}Month),-2))<=$(=addmonths(max({Current}Month),0))"}>}Value)
Please go through before link about Alternate state.
Please close the thread by marking correct answer & give likes if you like the post.


