Unlock a world of possibilities! Login now and discover the exclusive benefits awaiting you.

- Qlik Community
- :
- Forums
- :
- Analytics & AI
- :
- Products & Topics
- :
- App Development
- :
- Re: Max Number of Combinations
- Subscribe to RSS Feed
- Mark Topic as New
- Mark Topic as Read
- Float this Topic for Current User
- Bookmark
- Subscribe
- Mute
- Printer Friendly Page

 heiko_schmidt
- Mark as New
- Bookmark
- Subscribe
- Mute
- Subscribe to RSS Feed
- Permalink
- Report Inappropriate Content
Max Number of Combinations
Hello, for each day we track error codes from our QM System.
The error codes go from 1 to 30
Maybe something like this :
Date ErrorCode
| 01.01. | 1 |
| 01.01. | 5 |
| 01.01. | 18 |
| 01.01. | 26 |
| 02.01. | 1 |
| 02.01. | 5 |
| 03.01. | 26 |
| 03.01. | 29 |
| 03.01. | 14 |
| 04.01. | 5 |
| 04.01. | 18 |
| 04.01. | 26 |
| 04.01. | 29 |
Now i want to find out which error codes are most common in combination and would love to have something like frequency as measure.
Example:
as we see on 01.01. and 02.01. we habe error codes 1 and 5 in common. so for the day 02.01. the whole combination of errors already occurred on 01.01.
but when we compare 01.01. and 04.01. we see, that they have 3 out of 4 error codes in common and measure should tell me that this is the bigger hit.
Actually i do not know how to set up a measure for this one.
Any ideas?
best regards
Heiko

 Digvijay_Singh
- Mark as New
- Bookmark
- Subscribe
- Mute
- Subscribe to RSS Feed
- Permalink
- Report Inappropriate Content
What if you create a new field combining Date and Error Code and then count the occurrence of this field? You may use autonumber() to give a unique number for each combination..

- Mark as New
- Bookmark
- Subscribe
- Mute
- Subscribe to RSS Feed
- Permalink
- Report Inappropriate Content
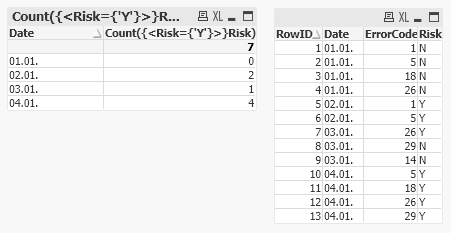
Are you looking something like this? If an ErrorCode occurred previously then it will add to the Risk.
tab1:
LOAD RowNo() As RowID,* INLINE [
    Date, ErrorCode
    01.01., 1
    01.01., 5
    01.01., 18
    01.01., 26
    02.01., 1
    02.01., 5
    03.01., 26
    03.01., 29
    03.01., 14
    04.01., 5
    04.01., 18
    04.01., 26
    04.01., 29
];

tab2:
LOAD RowID, ErrorCode, Date, If(Peek(ErrorCode)=ErrorCode And Not IsNull(Peek(Date)),'Y','N') As Risk
Resident tab1
Order By ErrorCode, Date;

Drop Table tab1;