Unlock a world of possibilities! Login now and discover the exclusive benefits awaiting you.
- Qlik Community
- :
- Forums
- :
- Analytics & AI
- :
- Products & Topics
- :
- App Development
- :
- Re: Negative values in pie chart
- Subscribe to RSS Feed
- Mark Topic as New
- Mark Topic as Read
- Float this Topic for Current User
- Bookmark
- Subscribe
- Mute
- Printer Friendly Page
- Mark as New
- Bookmark
- Subscribe
- Mute
- Subscribe to RSS Feed
- Permalink
- Report Inappropriate Content
Negative values in pie chart
Hello everyone,
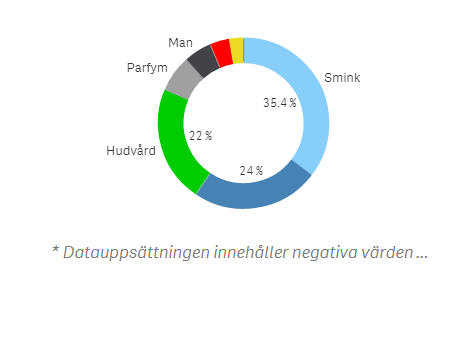
Does anyone know what "Data set contains negative values that can't be shown in the chart"? I've tried to supress the zeros, but it doesn't work. So I'm wondering how to Skip that line under the pie chart. A little help please? 😃
Sincerely,
Betty Habtemariam
- Tags:
- gauge
- negative values
- Mark as New
- Bookmark
- Subscribe
- Mute
- Subscribe to RSS Feed
- Permalink
- Report Inappropriate Content
pi chart is not the right object when you have negative values...! You need to use bar chart or line chart.
- Mark as New
- Bookmark
- Subscribe
- Mute
- Subscribe to RSS Feed
- Permalink
- Report Inappropriate Content
or u can use
FABS(expression) to use absolute value.
lik
FABS(Sum(Value))
- Mark as New
- Bookmark
- Subscribe
- Mute
- Subscribe to RSS Feed
- Permalink
- Report Inappropriate Content
Hi Betty,
If you want to just exclude zeros you should make off the show zeros functions at the properties panel, and change your formula like this:
if(myformula<=0,'',myformula)
G.
- Mark as New
- Bookmark
- Subscribe
- Mute
- Subscribe to RSS Feed
- Permalink
- Report Inappropriate Content
Hello Betty,
First question I have when I get such a message is whether there should be negative values... Most of the times, the negative values I got were wrong calculations that distorted the results. So my first solution would be to look critically at the data. Do they make sense if they are negative?
If they do make sense, then as already mentioned, a pie chart may not be the right way to show them (as a pie chart works in a cumulative way, you cannot create 'extra' pie with negative values).
Kind regards,
Johan
- Mark as New
- Bookmark
- Subscribe
- Mute
- Subscribe to RSS Feed
- Permalink
- Report Inappropriate Content
Hi Betty,
Try changing your measure expression like
sum({$<YourMeasure={">0"}>}YourMeasure)
Regards,
Rohan