Unlock a world of possibilities! Login now and discover the exclusive benefits awaiting you.
- Qlik Community
- :
- Forums
- :
- Analytics & AI
- :
- Products & Topics
- :
- App Development
- :
- Re: Number format within a Chart
- Subscribe to RSS Feed
- Mark Topic as New
- Mark Topic as Read
- Float this Topic for Current User
- Bookmark
- Subscribe
- Mute
- Printer Friendly Page
- Mark as New
- Bookmark
- Subscribe
- Mute
- Subscribe to RSS Feed
- Permalink
- Report Inappropriate Content
Number format within a Chart
Shown is my set expression within a measure on a chart:
if(vMeasurement = 'Count',
Count({$<MI_Priority = {'Critical','High'},FY_Year = {'$(vFYYear)'}>}[Incident Number]),
Sum({$<MI_Priority = {'Critical','High'},FY_Year = {'$(vFYYear)'}>}[Duration])
)
By the if statement, I will either be displaying a number or a duration. How do I change the formatting of the number within the chart? I've tried using custom, and adding 'Interval' to the part of the expression with the sum of the duration, but I can't get it to work.
- « Previous Replies
-
- 1
- 2
- Next Replies »
- Mark as New
- Bookmark
- Subscribe
- Mute
- Subscribe to RSS Feed
- Permalink
- Report Inappropriate Content
Can you give a little more information? What is your dimension? What does your data look like? What does your chart look like?
- Mark as New
- Bookmark
- Subscribe
- Mute
- Subscribe to RSS Feed
- Permalink
- Report Inappropriate Content
Sample Data:
Incident #, Month, Duration, Priority
INC001, Jan, 05:25,High
INC002, Jan, 00:45,Critical
INC003, Jan, 02:30,High
INC004, Feb, 01:15,High
INC005, Feb, 02:33,High
INC006, Feb, 00:45,High
INC007, Feb, 03:10,High
The dimension for my chart is Month.
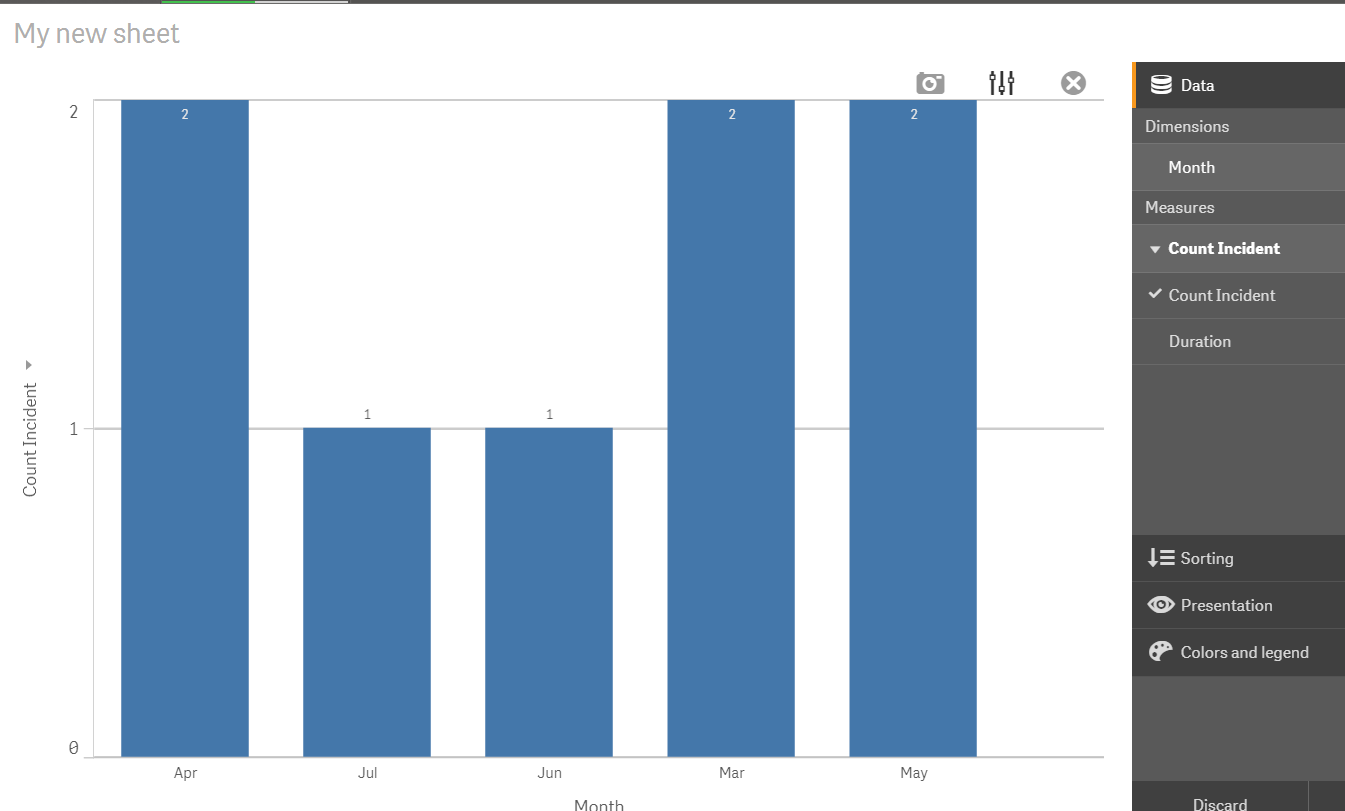
If I have a bar chart, based on count of Incident #, chart will show for Jan -3, Feb -4. The format of the measure will be number.
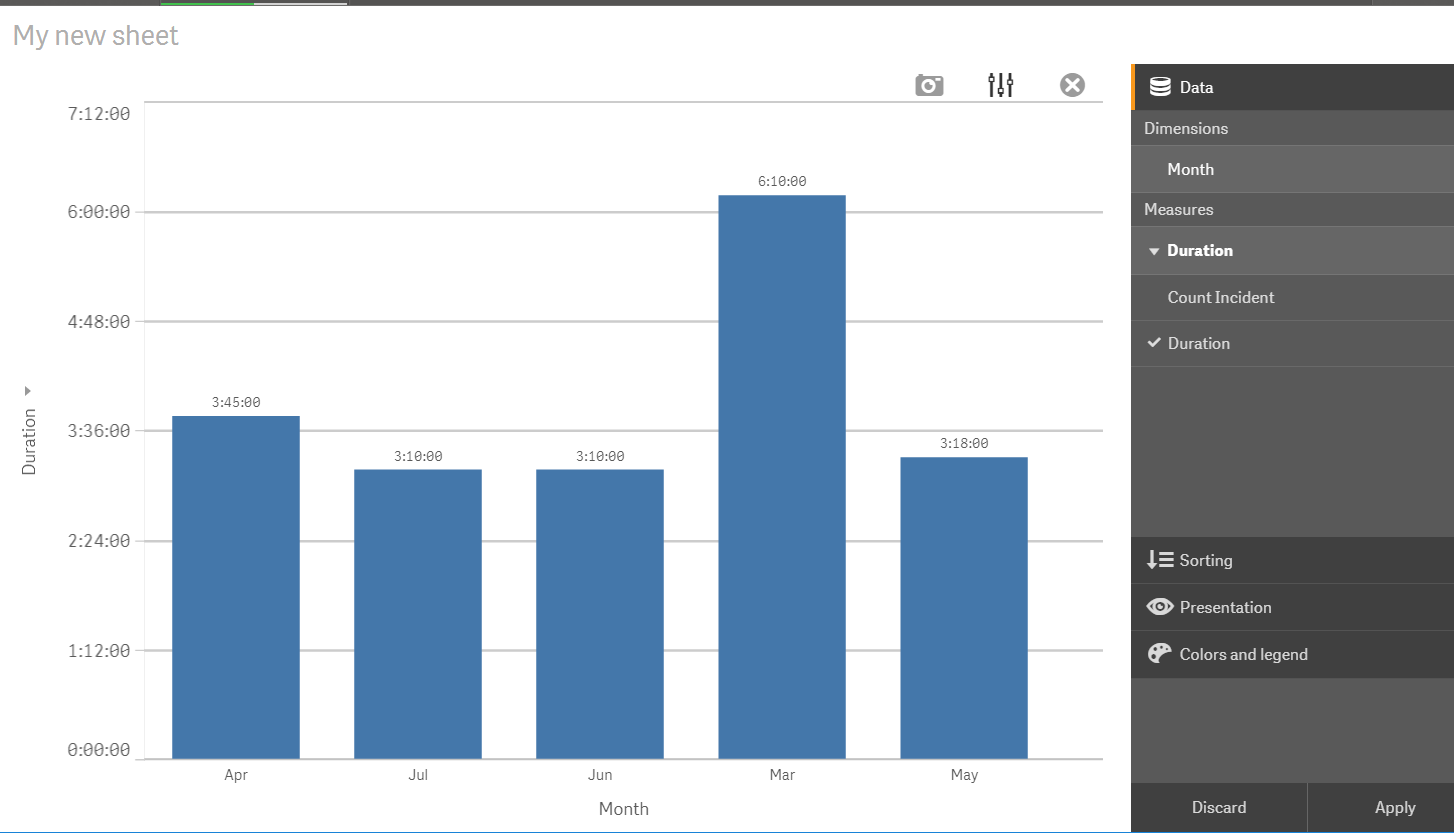
If I have a bar chart, based on sum of Duration, chart will show for Jan - 08:40, Feb -07:43. The format of the measure will be duration.
What I'd like to do is combine these 2 bar charts into 1 chart, using a variable to select either count or duration. But I can't figure out how to change the format of the measure between number and duration. I believe I can use custom, and then properly format the set statement, but I can't get it to work.
- Mark as New
- Bookmark
- Subscribe
- Mute
- Subscribe to RSS Feed
- Permalink
- Report Inappropriate Content
Hi Greg,
see Attachment.
Regards,
Antonio
- Mark as New
- Bookmark
- Subscribe
- Mute
- Subscribe to RSS Feed
- Permalink
- Report Inappropriate Content
Hi Antonio,
How do I properly view what you have sent me? I only see the load statement. I already have the data loaded.
Thanks,
Greg
- Mark as New
- Bookmark
- Subscribe
- Mute
- Subscribe to RSS Feed
- Permalink
- Report Inappropriate Content
You don't see this

- Mark as New
- Bookmark
- Subscribe
- Mute
- Subscribe to RSS Feed
- Permalink
- Report Inappropriate Content
Antonio - he is using Qlik Sense. Your app is in Qlik View
- Mark as New
- Bookmark
- Subscribe
- Mute
- Subscribe to RSS Feed
- Permalink
- Report Inappropriate Content
My apologies, I'm sorry.
- Mark as New
- Bookmark
- Subscribe
- Mute
- Subscribe to RSS Feed
- Permalink
- Report Inappropriate Content
I am trying this but so far not able to get both axis to display -- I put the values on the bars but that isnt what you want.
Maybe try adding as an alternate measure? I am going to try that
- Mark as New
- Bookmark
- Subscribe
- Mute
- Subscribe to RSS Feed
- Permalink
- Report Inappropriate Content
I tried adding as alternate measure then the user can display either way
- « Previous Replies
-
- 1
- 2
- Next Replies »