Unlock a world of possibilities! Login now and discover the exclusive benefits awaiting you.
- Qlik Community
- :
- Forums
- :
- Analytics & AI
- :
- Products & Topics
- :
- App Development
- :
- Re: Problems with sorting on drill down dimension
- Subscribe to RSS Feed
- Mark Topic as New
- Mark Topic as Read
- Float this Topic for Current User
- Bookmark
- Subscribe
- Mute
- Printer Friendly Page
- Mark as New
- Bookmark
- Subscribe
- Mute
- Subscribe to RSS Feed
- Permalink
- Report Inappropriate Content
Problems with sorting on drill down dimension
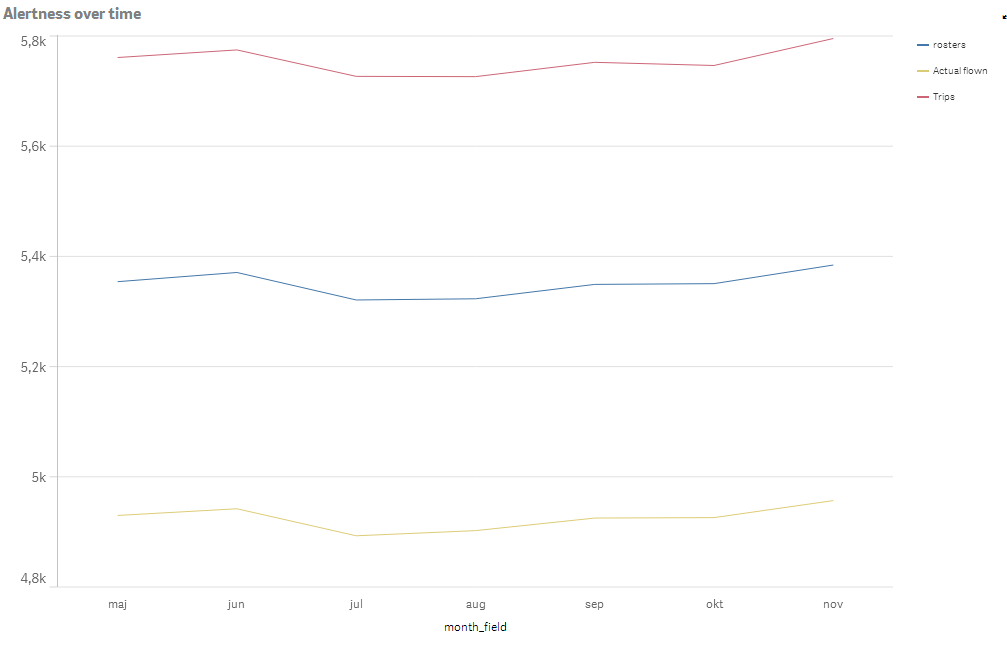
I have a line graph on a drill down dimension (month - day). The data shows up fine at first (when showing months) but when I drill down into a month (select a month and click confirm) the dates are not sorted properly but appears in what seem as random order. I have tried different sorting options in the chart configuration but without any luck.
Before selection:

After selecting a month:

Any help is appreciated!
/Viktor
- Tags:
- date
- drill-down
- « Previous Replies
-
- 1
- 2
- Next Replies »
- Mark as New
- Bookmark
- Subscribe
- Mute
- Subscribe to RSS Feed
- Permalink
- Report Inappropriate Content
Hi Viktor,
This is a known issue in our R&D department and people are working on that. Unfortunately, so far we only support sorting on the 'top layer' of a drill-down dimension. Let me think about it and see if we have any walk around of that for now.
- Mark as New
- Bookmark
- Subscribe
- Mute
- Subscribe to RSS Feed
- Permalink
- Report Inappropriate Content
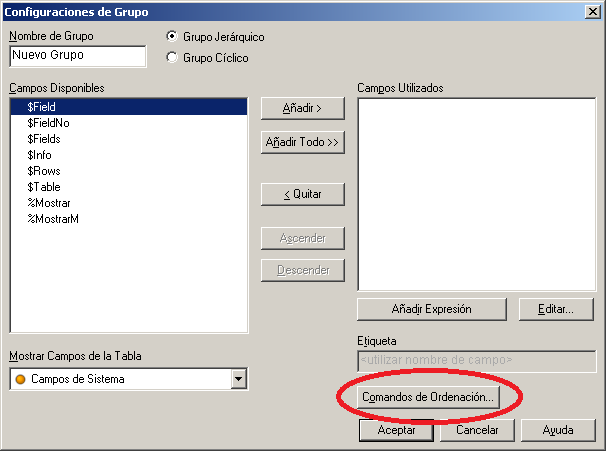
Hi Viktor, have you tried the 'Sort command...' button in the edit group window?:

- Mark as New
- Bookmark
- Subscribe
- Mute
- Subscribe to RSS Feed
- Permalink
- Report Inappropriate Content
Bohua,
Thanks for letting me know. I'll have to think about how to visualize longer time periods.
Ruben,
I'm using qlik sense so I don't have that option (I think).
- Mark as New
- Bookmark
- Subscribe
- Mute
- Subscribe to RSS Feed
- Permalink
- Report Inappropriate Content
Ops, sorry, i din't see it was for Sense.
- Mark as New
- Bookmark
- Subscribe
- Mute
- Subscribe to RSS Feed
- Permalink
- Report Inappropriate Content
Hi there - i think you can accomplish this using some data modelling techniques.
I just posted the technique in this other thread... respond in your current thread if you can't get it to work. I tried many ways and ended up with this . Also attached is a QVF sample.
- Mark as New
- Bookmark
- Subscribe
- Mute
- Subscribe to RSS Feed
- Permalink
- Report Inappropriate Content
Thank you, Jonathan. I will have a look at your solution and return to this thread with my findings ![]()
- Mark as New
- Bookmark
- Subscribe
- Mute
- Subscribe to RSS Feed
- Permalink
- Report Inappropriate Content
Hi.
I have the same problem, but im fetching my info from SQL server.
Could you help me fill in the formula? Can't seem to get it working in any way..
_____________________________
LIB CONNECT TO 'XX.XX.XX.X';
LOAD "No_" as Projekti,
"Creation Date" as PVM,
Day("Creation Date")*-1 as OrderDateFact,
Year("Creation Date")*-1 as OrderYearFact,
Month("Creation Date")*-1 as OrderMonthFact;
SQL SELECT "No_",
"Creation Date"
FROM "XXXXXXXXXXXX";
Years:
load distinct
OrderYearFact,
fabs(OrderYearFact) as OrderYear
resident OrdersHeader
order by OrderYearFact desc;
Months:
load distinct
OrderMonthFact,
left(monthName(date(fabs(OrderDateFact),3)),3) as OrderMonth
resident OrdersHeader
order by OrderMonthFact desc;
Dates:
load distinct
OrderDateFact,
date(fabs(OrderDateFact)) as OrderDate
resident OrdersHeader
order by OrderDateFact desc;
- Mark as New
- Bookmark
- Subscribe
- Mute
- Subscribe to RSS Feed
- Permalink
- Report Inappropriate Content
I think you only need to have PVM field in the OrdersHeader table.
Years:
load distinct
PVM,
Year(PVM) as OrderYear
resident OrdersHeader
order by PVM desc;
Months:
load distinct
PVM,
Month(PVM) as OrderMonth
resident OrdersHeader
order by OrderMonthFact desc;
etc...
- Mark as New
- Bookmark
- Subscribe
- Mute
- Subscribe to RSS Feed
- Permalink
- Report Inappropriate Content
Hi - the Years , Months, and Dates tables are loaded from the data that comes back from the first table.
In my script i named the first table OrdersHeader , but i don't see that in your example.
In the Load Editor, please add the following line in front of the first load as follows to give the table the correct name. That way when the other tables load from a table that is already 'resident ' , (ie: resident OrderHeader) it should work.
Then in you chart, don't use the 'fact' fields, you should see OrderDate,OrderYear, and OrderMonth available to build the drill down. Recreate the dimension from scratch as well as the chart.
let me know what happens ! ![]()
OrdersHeader:
LOAD "No_" as Projekti,
"Creation Date" as PVM,
Day("Creation Date")*-1 as OrderDateFact,
Year("Creation Date")*-1 as OrderYearFact,
Month("Creation Date")*-1 as OrderMonthFact;
SQL SELECT "No_",
"Creation Date"
FROM "XXXXXXXXXXXX";
- « Previous Replies
-
- 1
- 2
- Next Replies »