Unlock a world of possibilities! Login now and discover the exclusive benefits awaiting you.

- Qlik Community
- :
- Forums
- :
- Analytics & AI
- :
- Products & Topics
- :
- App Development
- :
- Re: QlikSense Log10 Graph X-Axis Label issue
- Subscribe to RSS Feed
- Mark Topic as New
- Mark Topic as Read
- Float this Topic for Current User
- Bookmark
- Subscribe
- Mute
- Printer Friendly Page

 Amit
Amit
- Mark as New
- Bookmark
- Subscribe
- Mute
- Subscribe to RSS Feed
- Permalink
- Report Inappropriate Content
QlikSense Log10 Graph X-Axis Label issue
Dear Community,
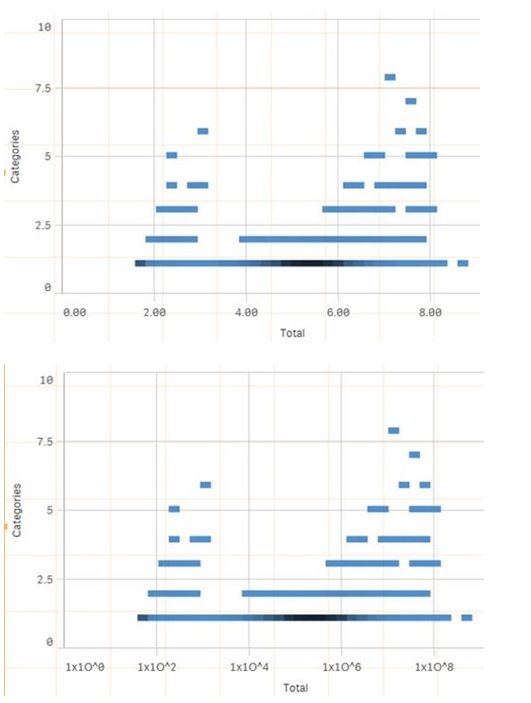
I am having to plot x-axis values using their log10 value. This works great but how do I get the values in the final scatter plot display as the actual number (i.e. 10 to the respective power value).
What I want on x-axis: “10, 100, 1000, 10000,…” etc
Instead of: “ 1,2,3,4,…” (with custom number formatting) OR “10^1, 10^2, 10^3, 10^4,…” (auto number formatting)
The expression currently used for the x-axis is : “num(log10(Sum(total)),'1x1O^0')”
Basically, I want the x-axis to look like “10, 100, 1000, 10000,…” etc and not “10^1, 10^2, 10^3, 10^4,…” .
Can anyone help? Thanks.

 Channa
- Mark as New
- Bookmark
- Subscribe
- Mute
- Subscribe to RSS Feed
- Permalink
- Report Inappropriate Content
you can try with Property Range
Min and Max try expressions
I am not sure, i get you right
