Unlock a world of possibilities! Login now and discover the exclusive benefits awaiting you.

- Qlik Community
- :
- Forums
- :
- Analytics & AI
- :
- Products & Topics
- :
- App Development
- :
- Re: Qliksense Pie chart showing addtitional values
- Subscribe to RSS Feed
- Mark Topic as New
- Mark Topic as Read
- Float this Topic for Current User
- Bookmark
- Subscribe
- Mute
- Printer Friendly Page

 Aspiring_Develo
- Mark as New
- Bookmark
- Subscribe
- Mute
- Subscribe to RSS Feed
- Permalink
- Report Inappropriate Content
Qliksense Pie chart showing addtitional values
Hello everyone,
I came accross a very strange behaviour below:-
I have below dimensions and measures :-
Dimension:- =valuelist('Direct labour N-1', 'Indirect Labour N-1','Total SG&A + R&D N-1')
Measure:-
if(valuelist('Direct labour N-1', 'Indirect Labour N-1','Total SG&A + R&D N-1')='Direct labour N-1',
num(sum({<Indicateur.Code = {'PO.1.161b'},[Site.isYFPO]={'0'},[Site.Participe]={'49|50'},Date.Year = , Date.MonthName = , Date.Quarter =, Date.Month =, Date.MonthEnd =, MonthYear=,Date=,NewTestvb1=,
Date= {"$(=MonthStart(Max(Date)))"} >} [Indicateur.Value])
/
sum({<Indicateur.Code = {'PO.1.137b'},[Site.isYFPO]={'0'},[Site.Participe]={'49|50'},Date.Year = , Date.MonthName = , Date.Quarter =, Date.Month =, Date.MonthEnd =, MonthYear=,Date=,NewTestvb1=,
Date= {"$(=MonthStart(Max(Date)))"}>} [Indicateur.Value])
,'###.#%'),
if(valuelist('Direct labour N-1', 'Indirect Labour N-1','Total SG&A + R&D N-1')='Indirect Labour N-1',
num(sum({<Indicateur.Code = {'PO.1.162b'},[Site.isYFPO]={'0'},[Site.Participe]={'49|50'},Date.Year = , Date.MonthName = , Date.Quarter =, Date.Month =, Date.MonthEnd =, MonthYear=,Date=,NewTestvb1=,
Date= {"$(=MonthStart(Max(Date)))"} >} [Indicateur.Value])
/
sum({<Indicateur.Code = {'PO.1.137b'},[Site.isYFPO]={'0'},[Site.Participe]={'49|50'},Date.Year = , Date.MonthName = , Date.Quarter =, Date.Month =, Date.MonthEnd =, MonthYear=,Date=,NewTestvb1=,
Date= {"$(=MonthStart(Max(Date)))"} >} [Indicateur.Value])
,'###.#%'),
if(valuelist('Direct labour N-1', 'Indirect Labour N-1','Total SG&A + R&D N-1')='Total SG&A + R&D N-1',
num(sum({<Indicateur.Code = {'PO.1.207b'},[Site.isYFPO]={'0'},[Site.Participe]={'49|50'},Date.Year = , Date.MonthName = , Date.Quarter =, Date.Month =, Date.MonthEnd =, MonthYear=,Date=,NewTestvb1=,
Date= {"$(=MonthStart(Max(Date)))"} >} [Indicateur.Value])
/
sum({<Indicateur.Code = {'PO.1.137b'},[Site.isYFPO]={'0'},[Site.Participe]={'49|50'},Date.Year = , Date.MonthName = , Date.Quarter =, Date.Month =, Date.MonthEnd =, MonthYear=,Date=,NewTestvb1=,
Date= {"$(=MonthStart(Max(Date)))"} >} [Indicateur.Value])
,'###.#%')
)
)
)
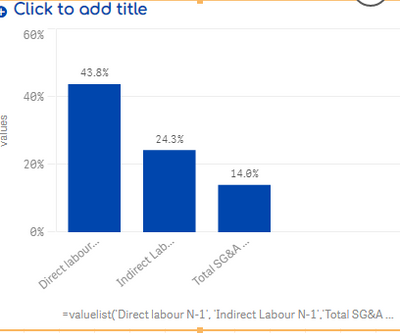
When i plot the above in bar chart , i get correct number s:-
But when i created a pie chart, it is showing some additional values like below:-
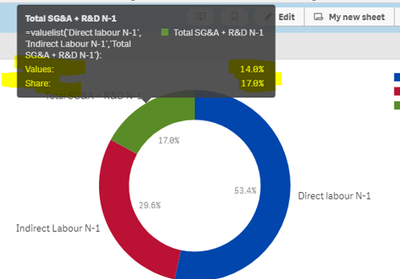
In the above chart, the number corresponding to label 'Values-14.0%' is correct. However, there is an additional label named 'share-17.0%' which i have not calculated but somehow it is appearing out of nowhere.
I am unable to understand why exactly it is working fine in bar chart and causing problem in pie chart.
Can anyone please help me if with this ? 😞
Accepted Solutions
Aspiring_Develo- Mark as New
- Bookmark
- Subscribe
- Mute
- Subscribe to RSS Feed
- Permalink
- Report Inappropriate Content
Hello ,
Thank you for your reply.
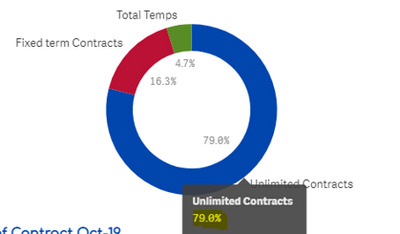
I solved it myself by following below steps:-
1) Go to 'Apperance' - -> 'Presentation tab and do below
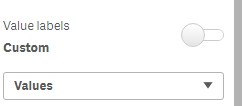
Post doing this, it will start showing you the value of your expression.
However, when you will hover on the chart, it will still you the value of Share%. In order to remove that, we make use of Qliksesne tool tip feature. I followed the below steps:
1)Go to tool tip, check the checkbox 'hide basic rows' and enter details of your dimensions and measures
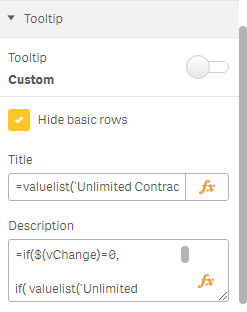
End Result:- It is showing actual values of the expression and no value for share is displayed

 Lisa_P
- Mark as New
- Bookmark
- Subscribe
- Mute
- Subscribe to RSS Feed
- Permalink
- Report Inappropriate Content
I think that for a pie chart you should have numbers not %s for a measure
Aspiring_Develo- Mark as New
- Bookmark
- Subscribe
- Mute
- Subscribe to RSS Feed
- Permalink
- Report Inappropriate Content
Hello ,
Thank you for your reply.
I solved it myself by following below steps:-
1) Go to 'Apperance' - -> 'Presentation tab and do below
Post doing this, it will start showing you the value of your expression.
However, when you will hover on the chart, it will still you the value of Share%. In order to remove that, we make use of Qliksesne tool tip feature. I followed the below steps:
1)Go to tool tip, check the checkbox 'hide basic rows' and enter details of your dimensions and measures
End Result:- It is showing actual values of the expression and no value for share is displayed
