Unlock a world of possibilities! Login now and discover the exclusive benefits awaiting you.

- Qlik Community
- :
- Forums
- :
- Analytics & AI
- :
- Products & Topics
- :
- App Development
- :
- line chart - missing values
Options
- Subscribe to RSS Feed
- Mark Topic as New
- Mark Topic as Read
- Float this Topic for Current User
- Bookmark
- Subscribe
- Mute
- Printer Friendly Page
Turn on suggestions
Auto-suggest helps you quickly narrow down your search results by suggesting possible matches as you type.
Showing results for

 ilanbaruch
Specialist
2021-01-30
07:03 AM
- Mark as New
- Bookmark
- Subscribe
- Mute
- Subscribe to RSS Feed
- Permalink
- Report Inappropriate Content
line chart - missing values
hi all
in my app i have a line chart with 2 expressions and date as dimension,
when there is no values between dates the line in the chart is not sowing zeros and connecting between data points i.e.
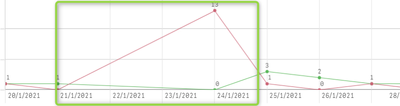
the line between 21-Jan to 24-Jan should be flat or missing.
changed in presentation Show as gaps/ Show as zeros , but there is no change in the chart.
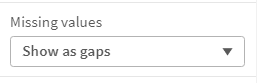
any ideas ?
advanced thanks
- Tags:
- line chart gaps
921 Views
1 Reply


2021-01-30
09:55 AM
- Mark as New
- Bookmark
- Subscribe
- Mute
- Subscribe to RSS Feed
- Permalink
- Report Inappropriate Content
Can you convert to Straight table and see?
Best Anil, When applicable please mark the correct/appropriate replies as "solution" (you can mark up to 3 "solutions". Please LIKE threads if the provided solution is helpful
