Unlock a world of possibilities! Login now and discover the exclusive benefits awaiting you.
- Qlik Community
- :
- Forums
- :
- Analytics & AI
- :
- Products & Topics
- :
- Connectivity & Data Prep
- :
- Re: Filter specific data
- Subscribe to RSS Feed
- Mark Topic as New
- Mark Topic as Read
- Float this Topic for Current User
- Bookmark
- Subscribe
- Mute
- Printer Friendly Page
- Mark as New
- Bookmark
- Subscribe
- Mute
- Subscribe to RSS Feed
- Permalink
- Report Inappropriate Content
Filter specific data
Hello,
How can I filter specific data?
I want to delete or want to show the data excluding ("All") in the graph.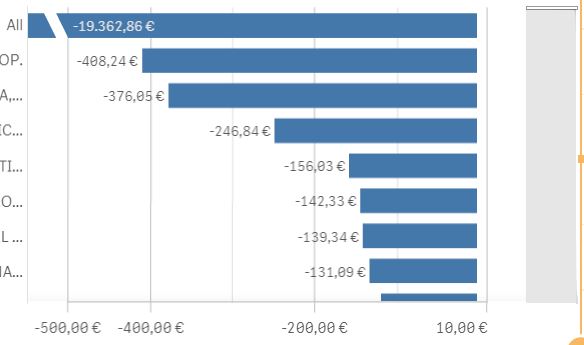
I have tried to set the range min/max but it didnt work.
I want the graph to show the data starting from -500 and assending order.
can you please help me out eith this.
Thank you,
Sachin
- « Previous Replies
-
- 1
- 2
- Next Replies »
Accepted Solutions
- Mark as New
- Bookmark
- Subscribe
- Mute
- Subscribe to RSS Feed
- Permalink
- Report Inappropriate Content
Exclude dimension value in your SetAnalysis
((Sum({$<[Year]={2017} , [CustomerName]-={'All'}>}[Gross Margin Actual Year]))
- (Sum({$<[Year]={"2016"},, [CustomerName]-={'All'}>}[Gross Margin Actual Year])))
Set Analysis: syntaxes, examples
If a post helps to resolve your issue, please accept it as a Solution.
- Mark as New
- Bookmark
- Subscribe
- Mute
- Subscribe to RSS Feed
- Permalink
- Report Inappropriate Content
Hi,
can you add more details ? the dimension, the expression.. the qvf file ?
- Mark as New
- Bookmark
- Subscribe
- Mute
- Subscribe to RSS Feed
- Permalink
- Report Inappropriate Content
Hello,
I am sorry, cannot add qvf file.
The dimensions are Customer name and Gross margin
And the expression in gross margin is
((Sum({$<[Year]={"2017"}>}[Gross Margin Actual Year])) - (Sum({$<[Year]={"2016"}>}[Gross Margin Actual Year])))
Regards,
Sachin
- Mark as New
- Bookmark
- Subscribe
- Mute
- Subscribe to RSS Feed
- Permalink
- Report Inappropriate Content
Try to uncheck "include null values" on the dimension parameters
- Mark as New
- Bookmark
- Subscribe
- Mute
- Subscribe to RSS Feed
- Permalink
- Report Inappropriate Content
It Is unchecked.
- Mark as New
- Bookmark
- Subscribe
- Mute
- Subscribe to RSS Feed
- Permalink
- Report Inappropriate Content
so you have a value called "All" in your dimension field ?
- Mark as New
- Bookmark
- Subscribe
- Mute
- Subscribe to RSS Feed
- Permalink
- Report Inappropriate Content
Yes & I want to exclude only that value in the graph and show the remaininng values.
- Mark as New
- Bookmark
- Subscribe
- Mute
- Subscribe to RSS Feed
- Permalink
- Report Inappropriate Content
so here it is:
((Sum({$<[Year]={"2017"},Customer-={'All'}>}[Gross Margin Actual Year])) - (Sum({$<[Year]={"2016"},Customer-={'All'}>}[Gross Margin Actual Year])))
- Mark as New
- Bookmark
- Subscribe
- Mute
- Subscribe to RSS Feed
- Permalink
- Report Inappropriate Content
No this does not works. It still gives me the value "All"
- Mark as New
- Bookmark
- Subscribe
- Mute
- Subscribe to RSS Feed
- Permalink
- Report Inappropriate Content
Exclude dimension value in your SetAnalysis
((Sum({$<[Year]={2017} , [CustomerName]-={'All'}>}[Gross Margin Actual Year]))
- (Sum({$<[Year]={"2016"},, [CustomerName]-={'All'}>}[Gross Margin Actual Year])))
Set Analysis: syntaxes, examples
If a post helps to resolve your issue, please accept it as a Solution.
- « Previous Replies
-
- 1
- 2
- Next Replies »