Unlock a world of possibilities! Login now and discover the exclusive benefits awaiting you.
- Qlik Community
- :
- Forums
- :
- Analytics & AI
- :
- Products & Topics
- :
- Connectivity & Data Prep
- :
- Re: How to sort data in Qlik Sense desktop
Options
- Subscribe to RSS Feed
- Mark Topic as New
- Mark Topic as Read
- Float this Topic for Current User
- Bookmark
- Subscribe
- Mute
- Printer Friendly Page
Turn on suggestions
Auto-suggest helps you quickly narrow down your search results by suggesting possible matches as you type.
Showing results for
Contributor
2018-09-12
09:56 AM
- Mark as New
- Bookmark
- Subscribe
- Mute
- Subscribe to RSS Feed
- Permalink
- Report Inappropriate Content
How to sort data in Qlik Sense desktop
So I have an Excel file with a table for unique codes and corresponding values
But whenever I upload the table, it sorts all the zero values first and then the non zero values
Also, the sorting order is messed up.
Any ideas how to fix this. I have attached the screenshots of Excel file and the Qlik Sense data that I want to see.
1,235 Views
2 Replies
Partner - Specialist III
2018-09-13
07:22 AM
- Mark as New
- Bookmark
- Subscribe
- Mute
- Subscribe to RSS Feed
- Permalink
- Report Inappropriate Content
Hi Mohit,
Do you need to display the zero values?
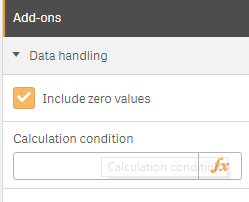
There's an option to remove the zero values from the expresion on the graph.
1,172 Views
Creator II
2018-09-27
05:13 AM
- Mark as New
- Bookmark
- Subscribe
- Mute
- Subscribe to RSS Feed
- Permalink
- Report Inappropriate Content
Hi mohit.rawal
You can use Data handling on Chart Edit and then uncheck Include zero values

Hope this helps,
Justin.
1,172 Views