Unlock a world of possibilities! Login now and discover the exclusive benefits awaiting you.
- Qlik Community
- :
- Forums
- :
- Analytics & AI
- :
- Products & Topics
- :
- Connectivity & Data Prep
- :
- Re: List Box with image
- Subscribe to RSS Feed
- Mark Topic as New
- Mark Topic as Read
- Float this Topic for Current User
- Bookmark
- Subscribe
- Mute
- Printer Friendly Page
- Mark as New
- Bookmark
- Subscribe
- Mute
- Subscribe to RSS Feed
- Permalink
- Report Inappropriate Content
List Box with image
Is it possible to create a list with image like circle.
For Example
- Mark as New
- Bookmark
- Subscribe
- Mute
- Subscribe to RSS Feed
- Permalink
- Report Inappropriate Content
Hi Irshad,
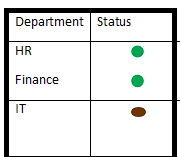
This can achieved in Expression editor of Striaght table chart as below:
Sample data i used:
departments:
Load * Inline [
department,percent
HR,80
IT,80
Finance,55
];
Dimension:
Department
Expression:
=if(sum(percent)>=80,'qmem://<bundled>/BuiltIn/led_g.png','qmem://<bundled>/BuiltIn/led_r.png')
You need to modify the expression little bit as per the color variations you need. Right now, I just used >80 as a condition for differentiation.
- Mark as New
- Bookmark
- Subscribe
- Mute
- Subscribe to RSS Feed
- Permalink
- Report Inappropriate Content
Your demonstration looks more like a table than a list box. If it is the case, you can set Chart properties > Expressions > Display Options > Representation as "Image". See the following post traffic light in straight table
- Mark as New
- Bookmark
- Subscribe
- Mute
- Subscribe to RSS Feed
- Permalink
- Report Inappropriate Content
Thanks for your response Vu.
Either Table or list box is Ok but I am looking for solution in qlik sense.
- Mark as New
- Bookmark
- Subscribe
- Mute
- Subscribe to RSS Feed
- Permalink
- Report Inappropriate Content
It's not supported in Qlik Sense native table/ filter pane. You need to use an extension such as the following https://github.com/danielpilla/sense-images-links-extension
- Mark as New
- Bookmark
- Subscribe
- Mute
- Subscribe to RSS Feed
- Permalink
- Report Inappropriate Content
Dear Vu and Neeima,
thank you very much for your response, I will try and let you know if there is any issue.