Unlock a world of possibilities! Login now and discover the exclusive benefits awaiting you.
- Qlik Community
- :
- All Forums
- :
- Connectivity & Data Prep
- :
- Re: Perform calculations based on certain cells in...
- Subscribe to RSS Feed
- Mark Topic as New
- Mark Topic as Read
- Float this Topic for Current User
- Bookmark
- Subscribe
- Mute
- Printer Friendly Page
- Mark as New
- Bookmark
- Subscribe
- Mute
- Subscribe to RSS Feed
- Permalink
- Report Inappropriate Content
Perform calculations based on certain cells in a column.
Hi,
I'm new to Qlik. I'm trying to create a dashboard for a backpacker hostel. I want to calculate occupancy based on grouping of room types. I have the following data:
Example, I need to find the combined available inventory on each of the dates for
Standard Rooms + Deluxe Rooms + Luxury Rooms + Designer Suites
6 Bed Mixed Dorm + 8 Bed Mixed Dorm
Can anyone help me with this?
| Hotel Code | Room Types | Total Inventory | Available Inventory | Date | Blocked Rooms |
| 1056 | 6 Bed Mixed Dorm | 18 | 14 | 8/1/2016 | 0 |
| 1056 | 8 Bed Mixed Dorm | 32 | 24 | 8/1/2016 | 0 |
| 1056 | Standard Rooms | 14 | 4 | 8/1/2016 | 3 |
| 1056 | Deluxe Rooms | 8 | 4 | 8/1/2016 | 1 |
| 1056 | Luxury Rooms | 7 | 5 | 8/1/2016 | 0 |
| 1056 | Designer Suites | 2 | 2 | 8/1/2016 | 0 |
| 1056 | 6 Bed Female Dorm | 6 | 1 | 8/1/2016 | 0 |
| 1056 | 6 Bed Mixed Dorm | 18 | 13 | 8/2/2016 | 0 |
| 1056 | 8 Bed Mixed Dorm | 32 | 20 | 8/2/2016 | 0 |
| 1056 | Standard Rooms | 14 | 1 | 8/2/2016 | 4 |
| 1056 | Deluxe Rooms | 8 | 4 | 8/2/2016 | 1 |
| 1056 | Luxury Rooms | 7 | 5 | 8/2/2016 | 0 |
| 1056 | Designer Suites | 2 | 2 | 8/2/2016 | 0 |
| 1056 | 6 Bed Female Dorm | 6 | 3 | 8/2/2016 | 0 |
- Mark as New
- Bookmark
- Subscribe
- Mute
- Subscribe to RSS Feed
- Permalink
- Report Inappropriate Content
Not sure what your expected output needs to look like but can you use Hotel Code and Date as your dimension and Sum([Available Inventory]) as your expression in a table?
- Mark as New
- Bookmark
- Subscribe
- Mute
- Subscribe to RSS Feed
- Permalink
- Report Inappropriate Content
Hi Sunny,
I want to group
- (Standard Rooms + Deluxe Rooms + Luxury Rooms + Designer Suites) as Private rooms
- (6 Bed Mixed Dorm + 8 Bed Mixed Dorm) as Dorms
Then I want to display total available inventory of Private Rooms and Dorms based on dates.
- Mark as New
- Bookmark
- Subscribe
- Mute
- Subscribe to RSS Feed
- Permalink
- Report Inappropriate Content
Then you can create a calculated dimension
Dimensions
Hotel Code
Date
If(Match([Room Types], '6 Bed Mixed Dorm', '8 Bed Mixed Dorm'), 'Dorms', 'Private Rooms')
Expression
Sum([Available Inventory])
- Mark as New
- Bookmark
- Subscribe
- Mute
- Subscribe to RSS Feed
- Permalink
- Report Inappropriate Content
Hi Aviral,
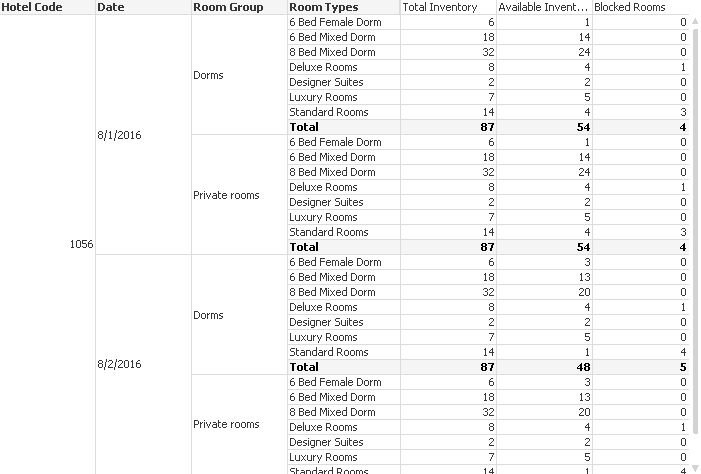
you can create something similar using Pivot table.
First you need a extra grouping table:
Grouping:
Load
*
Inline [
Room Type, Room Group
6 Bed Mixed Dorm, Dorms
8 Bed Mixed Dorm, Dorms
Standard Rooms, Private rooms
Deluxe Rooms, Private rooms
Luxury Rooms, Private rooms
Designer Suites, Private rooms
]
;
And then create a Pivot table chart with the Room Group as dimension.
You can then enable Show partial sums (in Presentation tab) on the dimension level below the group.
The result looks like this, first 4 columns are dimensions, last 3 are expressions.

If you need a full table looking exactly like the one you have, that would be more complicated - using aggr().
BR,
Matus
- Mark as New
- Bookmark
- Subscribe
- Mute
- Subscribe to RSS Feed
- Permalink
- Report Inappropriate Content
Works like a charm. Thanks a lot ![]()
- Mark as New
- Bookmark
- Subscribe
- Mute
- Subscribe to RSS Feed
- Permalink
- Report Inappropriate Content
Thanks Matus. This works ![]()