Unlock a world of possibilities! Login now and discover the exclusive benefits awaiting you.
- Qlik Community
- :
- Forums
- :
- Groups
- :
- Industry and Topics
- :
- Deployment Framework
- :
- Re: Stacked Bar chart ignore 2nd dimension
- Subscribe to RSS Feed
- Mark Topic as New
- Mark Topic as Read
- Float this Topic for Current User
- Bookmark
- Subscribe
- Mute
- Printer Friendly Page
- Feature this Topic
- Mark as New
- Bookmark
- Subscribe
- Mute
- Subscribe to RSS Feed
- Permalink
- Report Inappropriate Content
Stacked Bar chart ignore 2nd dimension
Hi
I wanted to produce a chart which can ignore 2nd dimension here 'Flag'. I am able to produce the graph using Excel but in need to get the same as interactive chart in QlikView.
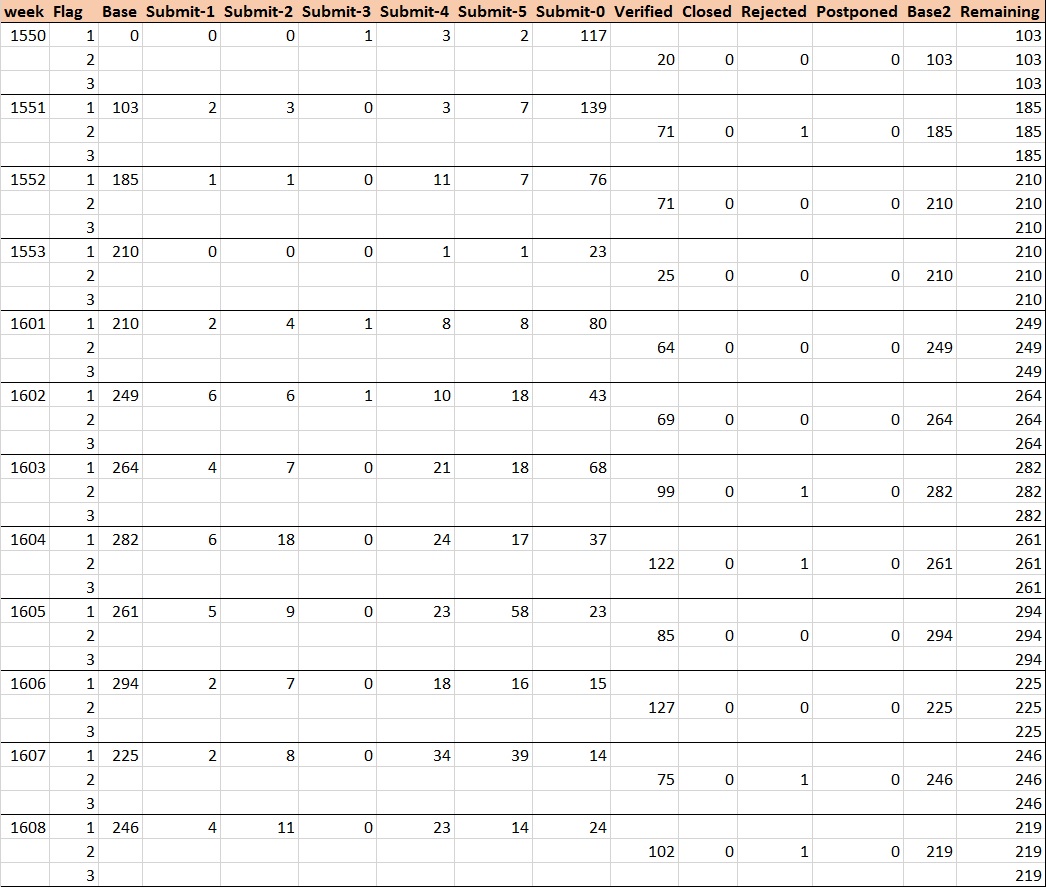
Here is the data i prepared in Excel ChartData-1

And i am able to produce below chart in Excel

to create the same chart i have done back end processing in QlikView load script to format the data as ChartData-1 but this will be static and this data will not change based on selection in list box.
I was able to make the same data format in Pivot table, for that I created "Flag" Field to separate the data, but I am unable to get "Remaining" from it. since Remaining will be calculated based on Dimension, now i need to ignore the 2nd dimension in chart to get the exact value.
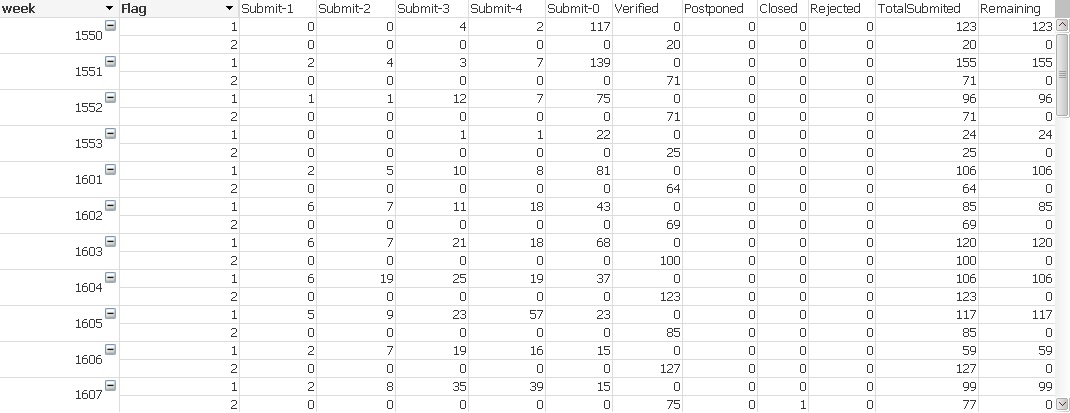
Here is the Pivot table which i created in QlikView.

Where TotalSubmited= (Submit-1+Submit-2+Submit-3+Submit-4+Submit-0)
and Remaining = TotalSubmited - (Verified+Postponed+Closed+Rejected)
I need TotalSubmited and Remaining to have same value for both the flag in a week.
Pleas help solving this problem. Thanks in advance.
- Tags:
- Group_Discussions
Accepted Solutions
- Mark as New
- Bookmark
- Subscribe
- Mute
- Subscribe to RSS Feed
- Permalink
- Report Inappropriate Content
Hi All,
I found the solution by using below expression.
Alt(Above(TOTAL if(Flag=1, RealTotalSubmit)))
Thanks for trying.
Regards
Purushotham
- Mark as New
- Bookmark
- Subscribe
- Mute
- Subscribe to RSS Feed
- Permalink
- Report Inappropriate Content
Can you post the excel file?
talk is cheap, supply exceeds demand
- Mark as New
- Bookmark
- Subscribe
- Mute
- Subscribe to RSS Feed
- Permalink
- Report Inappropriate Content
What are the expressions behind Submit-1, Submit-2, Submit-3 etc? Making an assumption that they are Sum(Measure1), Sum(Measure2), Sum(Measure3) and so on, this is what you can try:
Total Submitted
RangeSum(
Sum(TOTAL <Week> Measrure1),
Sum(TOTAL <Week> Measrure2),
Sum(TOTAL <Week> Measrure3),
Sum(TOTAL <Week> Measrure4),
Sum(TOTAL <Week> Measrure0))
Remaining
[Total Submitted] -
RangeSum(
Sum(TOTAL <Week> Verified),
Sum(TOTAL <Week> Postponed),
Sum(TOTAL <Week> Closed),
Sum(TOTAL <Week> Rejected))
So the main thing here is the use of TOTAL here. Read about it here: What does the TOTAL qualifier do?
- Mark as New
- Bookmark
- Subscribe
- Mute
- Subscribe to RSS Feed
- Permalink
- Report Inappropriate Content
Hi,
Here is the excel containing example. please do the needful.
- Mark as New
- Bookmark
- Subscribe
- Mute
- Subscribe to RSS Feed
- Permalink
- Report Inappropriate Content
Use this script:
CrossTable(Status, Value,2)
LOAD Floor(wk) as wk,
Floor(Flag) as Flag,
[Submit-1],
[Submit-2],
[Submit-3],
[Submit-4],
[Submit-5],
[Submit-0],
Verified,
Closed,
Rejected,
Postponed,
Base1,
Base2,
Base3
FROM
[ChartData.xlsx]
(ooxml, embedded labels, table is ALL_D, filters( Replace(1, top, StrCnd(null))))
;
Then create a bar chart with the following dimensions:
- wk
- Flag
- Status
And use sum(Value) as expression.
Click on the + in front of the expression on the Expressions tab, select Background color and enter an expression that sets the background color for Base1 and Base2 to transparent: if(Match(Status, 'Base1','Base2'),red(0),color(FieldIndex('Status',Status)))
talk is cheap, supply exceeds demand
- Mark as New
- Bookmark
- Subscribe
- Mute
- Subscribe to RSS Feed
- Permalink
- Report Inappropriate Content
Hi Thanks for the response.
I have huge data to be processed behind and I can't include that data as sample.
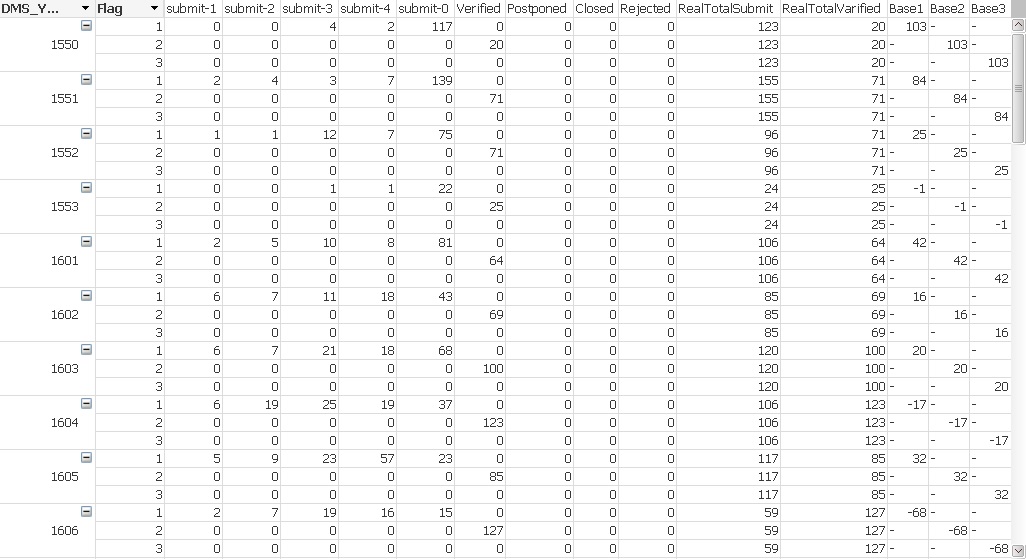
but I am able to get exact values as chart below, but i am unable to get the previous row value using
Here is the formula
RealTotalSubmit= (Submit-1 + Submit-2 + Submit-3 + Submit-4 + Submit-0)
RealToalVarified= (Verified+Postponed+Closed+Rejected)
Base1 =if(Flag=1, RealTotalSubmit)
Base2 =if(Flag=1, RealTotalSubmit)
Base3 =if(Flag=1, RealTotalSubmit)
I tried 'Base1 = Above(Base3)', but not working.
I can get accumulation in bar chart so in just need Base1 to get the previous Remaining value for Base3 or Base2

- Mark as New
- Bookmark
- Subscribe
- Mute
- Subscribe to RSS Feed
- Permalink
- Report Inappropriate Content
Hi All,
I found the solution by using below expression.
Alt(Above(TOTAL if(Flag=1, RealTotalSubmit)))
Thanks for trying.
Regards
Purushotham