Unlock a world of possibilities! Login now and discover the exclusive benefits awaiting you.
- Qlik Community
- :
- All Forums
- :
- Deployment & Management
- :
- Re: Operations Monitor Load Failing and taking an ...
- Subscribe to RSS Feed
- Mark Topic as New
- Mark Topic as Read
- Float this Topic for Current User
- Bookmark
- Subscribe
- Mute
- Printer Friendly Page
- Mark as New
- Bookmark
- Subscribe
- Mute
- Subscribe to RSS Feed
- Permalink
- Report Inappropriate Content
Operations Monitor Load Failing and taking an average of 35 Min when successful
I have a new Qlik Sense Server 2.1.1 installation that is only about a week old.
I am seeing CPU spikes and load errors, that as near as I can tell are due to the Operations Monitor Load starting to take a very long time.
From looking at the Operations_Monitor_Reload_Stats_2.1.txt file, it looks like the number of rows it was trying to import got successively larger and the load is completing successfully fewer and fewer times each day, and taking longer and longer to load when it does. It looks like it is also causing other reload tasks to fail while it is running (which I'm guessing may be creating more log entries and making this problem even worse)
I had some installation challenges based on how I was trying to securely configure this in an AWS VPC, but have those sorted out now. Is this because of log files generated during this time? I don't need the historical log files at this point (and would actually rather get them out of the Operations Monitor App.
What's the best way to purge existing log data from the logs and the app?
Also of note, is that the CPU spikes that tend to happen while it is loading start about 30 minutes into the load process. I upgraded the server to a c4.4xlarge (16 vCPU & 30 GB of RAM), and it still manages to peg all 16 vCPUs. In the Operations Management app when in the performance sheet, when I try to expand any of the hour rows, it spikes RAM usage and exhausts RAM before coming back and saying Error, Out of calculation memory.
Thanks in advance for any assistance
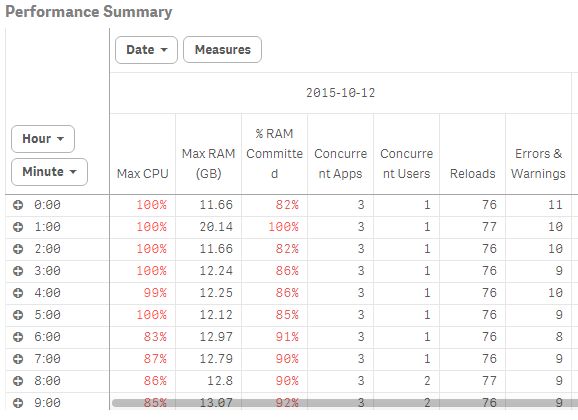
RAM Spike when try to expand performance Summary

Most Recent Operations_Monitor_Reload_Stats_2.1.txt Entries
| 299 | 2015-10-11 00:07:50 | INFO | FD-QLIK-1 | Reload Start | Reloading Operations Monitor 2.1 from FD-QLIK-1 running version 2.1.1+Build:22.origin/release/ms13 | Operations Monitor |
| 300 | 2015-10-11 00:08:12 | INFO | FD-QLIK-1 | Reload Finish | Reloaded at 2015-10-11 00:08:12 on fd-qlik-1 for 00:00:22 with 94,816 log entries. | Operations Monitor |
| 301 | 2015-10-11 01:07:50 | INFO | FD-QLIK-1 | Reload Start | Reloading Operations Monitor 2.1 from FD-QLIK-1 running version 2.1.1+Build:22.origin/release/ms13 | Operations Monitor |
| 302 | 2015-10-11 01:09:59 | INFO | FD-QLIK-1 | Reload Finish | Reloaded at 2015-10-11 01:09:59 on fd-qlik-1 for 00:02:09 with 142,198 log entries. | Operations Monitor |
| 303 | 2015-10-11 02:07:50 | INFO | FD-QLIK-1 | Reload Start | Reloading Operations Monitor 2.1 from FD-QLIK-1 running version 2.1.1+Build:22.origin/release/ms13 | Operations Monitor |
| 304 | 2015-10-11 02:13:32 | INFO | FD-QLIK-1 | Reload Finish | Reloaded at 2015-10-11 02:13:32 on fd-qlik-1 for 00:05:42 with 232,630 log entries. | Operations Monitor |
| 305 | 2015-10-11 03:07:50 | INFO | FD-QLIK-1 | Reload Start | Reloading Operations Monitor 2.1 from FD-QLIK-1 running version 2.1.1+Build:22.origin/release/ms13 | Operations Monitor |
| 306 | 2015-10-11 03:19:20 | INFO | FD-QLIK-1 | Reload Finish | Reloaded at 2015-10-11 03:19:20 on fd-qlik-1 for 00:11:30 with 360,970 log entries. | Operations Monitor |
| 307 | 2015-10-12 13:07:50 | INFO | FD-QLIK-1 | Reload Start | Reloading Operations Monitor 2.1 from FD-QLIK-1 running version 2.1.1+Build:22.origin/release/ms13 | Operations Monitor |
| 308 | 2015-10-12 13:43:30 | INFO | FD-QLIK-1 | Reload Finish | Reloaded at 2015-10-12 13:43:30 on fd-qlik-1 for 00:35:40 with 881,305 log entries. | Operations Monitor |
| 309 | 2015-10-12 14:07:50 | INFO | FD-QLIK-1 | Reload Start | Reloading Operations Monitor 2.1 from FD-QLIK-1 running version 2.1.1+Build:22.origin/release/ms13 | Operations Monitor |
| 310 | 2015-10-12 14:43:38 | INFO | FD-QLIK-1 | Reload Finish | Reloaded at 2015-10-12 14:43:38 on fd-qlik-1 for 00:35:48 with 882,142 log entries. | Operations Monitor |
- « Previous Replies
-
- 1
- 2
- Next Replies »
Accepted Solutions
- Mark as New
- Bookmark
- Subscribe
- Mute
- Subscribe to RSS Feed
- Permalink
- Report Inappropriate Content
Concerning purging the logs - do the following:
- Move the folder(s) inside "qlik\sense\repository\archived logs" to some other location (I would keep them, just in case). For single-node deployment, you should just have the one folder named after the machine.
- Move all QVDs from the qlik\sense\log folder to the same backup place you moved the archived logs in #1.
Note - this might require some trickery if the QVDs get locked or you are not the user running the qlik sense services. - Reload the Monitor apps. If you still have this issue, then you might want to remove some logs from qlik\sense\log\[service], but I doubt you will see that.
However you purge the old logs, though, I would be interested in knowing more about the log situation when you were having issues. Will help for identifying any issues with the logs and/or the logic used by the Operations Monitor. Thanks! (You can post them or mail them directly to me twa@qlik.com
- Mark as New
- Bookmark
- Subscribe
- Mute
- Subscribe to RSS Feed
- Permalink
- Report Inappropriate Content
Tim,
The increase in log entries certainly seems fast - from 94k in the morning to 360k in the afternoon - and 882k by the next day. The more log entries, the longer the reload will take - though it should scale better than it appears to be scaling in your case.
The ramp up in reload duration and memory usage might also be related to an issue just reported late last week in which hung tasks (in that case user directory sync task) had started but were not terminated properly, resulting in many log entries but in an extremely long reload duration (days....).
Can you check the Operations Monitor > Reload details page and post a screen shot of it?
Mainly looking for duration, so if you can capture the max duration in the table on that page or also in the dropdown filter "Reload Duration".
Tyler
- Mark as New
- Bookmark
- Subscribe
- Mute
- Subscribe to RSS Feed
- Permalink
- Report Inappropriate Content
Follow-up question about the Performance detail chart - can you describe 'expand performance summary'? Is it just clicking on one of the "+"?
- Mark as New
- Bookmark
- Subscribe
- Mute
- Subscribe to RSS Feed
- Permalink
- Report Inappropriate Content
Concerning purging the logs - do the following:
- Move the folder(s) inside "qlik\sense\repository\archived logs" to some other location (I would keep them, just in case). For single-node deployment, you should just have the one folder named after the machine.
- Move all QVDs from the qlik\sense\log folder to the same backup place you moved the archived logs in #1.
Note - this might require some trickery if the QVDs get locked or you are not the user running the qlik sense services. - Reload the Monitor apps. If you still have this issue, then you might want to remove some logs from qlik\sense\log\[service], but I doubt you will see that.
However you purge the old logs, though, I would be interested in knowing more about the log situation when you were having issues. Will help for identifying any issues with the logs and/or the logic used by the Operations Monitor. Thanks! (You can post them or mail them directly to me twa@qlik.com
- Mark as New
- Bookmark
- Subscribe
- Mute
- Subscribe to RSS Feed
- Permalink
- Report Inappropriate Content
I already replaced the app with an empty copy (following directions from you to another user in a different post), and purged the logs. Right now things all look pretty good, but if this issue comes back again will definitely post.
Also, not sure if this is the root cause or not, but it looks like the Archived Logs \ Script folder is growing at a very fast pace. That was the largest log folder out there by far at about 868 MB. I have 2 apps reloading now, one which reloads every 5 minutes and another that reloads every minute. Since each file in this folder contains a copy of the reload script that was run, over and over, the logging seems a bit excessive. For a server running frequent jobs like this, is there a way to reduce the logging volume created from reloads? I looked under Repository settings in the QMC, but didn't see one that obviously mapped to reload scripsts. Currently the first 2 are set to Basic, and all the rest are set to Info.
- Mark as New
- Bookmark
- Subscribe
- Mute
- Subscribe to RSS Feed
- Permalink
- Report Inappropriate Content
Yes, it happened if I clicked one of the "+" buttons to the left of any of the hour rows.
- Mark as New
- Bookmark
- Subscribe
- Mute
- Subscribe to RSS Feed
- Permalink
- Report Inappropriate Content
Good to hear you are back in business. And yes, please post or email directly if this issue comes up again. If you experience, it is likely others will. 
Did you see which subfolder there is growing the fastest? Maybe the Script folder? A log is created for each reload, so if you have a reload happening every minute, that's 1,440 logs per day .
Log settings sound fine.
- Mark as New
- Bookmark
- Subscribe
- Mute
- Subscribe to RSS Feed
- Permalink
- Report Inappropriate Content
That is not what I would expect (or have seen).
If you want me to look further, you could send me directly the app or post it privately.
- Mark as New
- Bookmark
- Subscribe
- Mute
- Subscribe to RSS Feed
- Permalink
- Report Inappropriate Content
The Script folder was definitely the largest, but the Scheduler folder was fairly large as well.
Here are file counts & sizes for each:
AppMigration - 43 Files (1.05 MB)
DataProfiling - 7 Files (6.36 KB)
Engine - 145 Files (32.8 MB)
Printing - 16 Files (19.6 KB)
Proxy - 108 Files (17.6 MB)
Repository - 110 Files (7.59 MB)
Scheduler - 96 Files (241 MB)
Script - 11,853 Files ( 612 MB)
Is there a way to reduce or turn off that logging since I have 1 app loading every min (creating a 25K file each time) and another loading every 5 min (creating a 67K file each time)?
- Mark as New
- Bookmark
- Subscribe
- Mute
- Subscribe to RSS Feed
- Permalink
- Report Inappropriate Content
You are not the first to ask about turning off the script log file. I am not aware of any way to do that at the moment.
- « Previous Replies
-
- 1
- 2
- Next Replies »