Unlock a world of possibilities! Login now and discover the exclusive benefits awaiting you.
- Qlik Community
- :
- Blogs
- :
- Technical
- :
- Design
- :
- Totals in Charts
- Subscribe to RSS Feed
- Mark as New
- Mark as Read
- Bookmark
- Subscribe
- Printer Friendly Page
- Report Inappropriate Content
The total in a chart is not the sum of the individual rows of the chart.
Instead, the total and the subtotals are calculated using the expression – but on a larger subset of the data than for the individual row.
Usually, the two methods result in the same numbers, but sometimes there is a huge difference. One example of this is if you use a non-linear function, e.g. Count(distinct …) as expression. The example below clearly shows this.
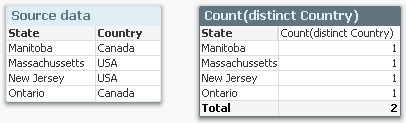
The source data to the left assigns a country to each state, and if you count the number of countries per state using a Count(distinct Country), you will get the chart to the right: Each state belongs to one country only, and the total number of countries is 2, also if the chart has four rows.
A second example is if you have a many-to-many relationship in the data. In the example below, you have three products, each with a sales amount. But since each product can belong to several product groups, the sales amounts per product group will not add up: The total will be smaller than the sum of the individual rows, since there is an overlap between the product groups. The summation will be made in the fact table.
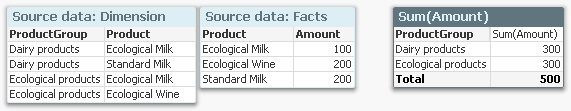
Another way to describe it would be to say that a specific dollar belongs to both product groups, and would be counted twice if you just summed the rows.
In both cases, QlikView will show the correct number, given the data. To sum the rows would be incorrect.
So, how does this affect you as an application developer?
Normally not very much. But it is good to be aware of it, and I would suggest the following:
- When you write your expression, you should have the total line in mind. Usually, the expression will automatically be right also for the individual rows.
- Always use an aggregation function. This will ensure that QlikView is able to calculate the total correctly.
- If you want an average on the total line, you should most likely divide your expression with Count(distinct <Dim>). Then it will work both for the individual rows (where the count is 1) and the total lines. Example
Sum( Amount ) / Count( distinct Customer )
- For cases where you want to show something completely different in the total line, you should consider the Dimensionality() function, that returns 0, 1, 2, … depending on whether the evaluation takes place in a total, subtotal or row. Example:
If( Dimensionality() = 0, <Total line expression>, <Individual line expression> )
But If I want to show the sum of the individual rows? I don’t want the expression to be calculated over a larger data set. What do I do then?
There are two ways to do this. First, you can use an Aggr() function as expression:
Sum( Aggr( <Original expression> , <Dimension> ) )
This will work in all objects. Further, if you have a straight table, you have a setting on the Expressions tab where you can specify the Total mode.
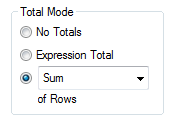
Setting this to Sum of Rows will change the chart behavior to show exactly this: The sum of the rows.
You must be a registered user to add a comment. If you've already registered, sign in. Otherwise, register and sign in.