Unlock a world of possibilities! Login now and discover the exclusive benefits awaiting you.
- Qlik Community
- :
- Forums
- :
- Groups
- :
- Location and Language
- :
- Francophones
- :
- Re: Using rangesum and above and below to calculat...
- Subscribe to RSS Feed
- Mark Topic as New
- Mark Topic as Read
- Float this Topic for Current User
- Bookmark
- Subscribe
- Mute
- Printer Friendly Page
- Feature this Topic
- Mark as New
- Bookmark
- Subscribe
- Mute
- Subscribe to RSS Feed
- Permalink
- Report Inappropriate Content
Using rangesum and above and below to calculate 12 months rolling total in graphs
Dear all,
I posted a previous post https://community.qlik.com/message/981234?et=watches.email.thread#981234, related to this in which I got a full answer by sunny T, by the way.
but I can't manage to adapt it to MAT calculations.
in my need there are 2 concerns:
1) being able for a period dimension in the format yearmonth (201501, 201502 ...) to graph the result of 2 expressions one related to the exact period and one related to the same period BUT last Year.
2) not just calculating the sum for the specific month and same month last year, but having MAT= 12 months rolling total... this is where the rangesum and above play a role.
can sombody adapt this working version in YTD in MAT PLEASE ?
I attached the working QW app with YTD expressions
I added also an excel to better explain what I would like....
crossing my fingers !
- « Previous Replies
-
- 1
- 2
- Next Replies »
Accepted Solutions
- Mark as New
- Bookmark
- Subscribe
- Mute
- Subscribe to RSS Feed
- Permalink
- Report Inappropriate Content
I have put a condition so that you don't compare a 1-11 month number to a 12 month number. If I remove the conditions (RowNo > 23) you will see something like this:
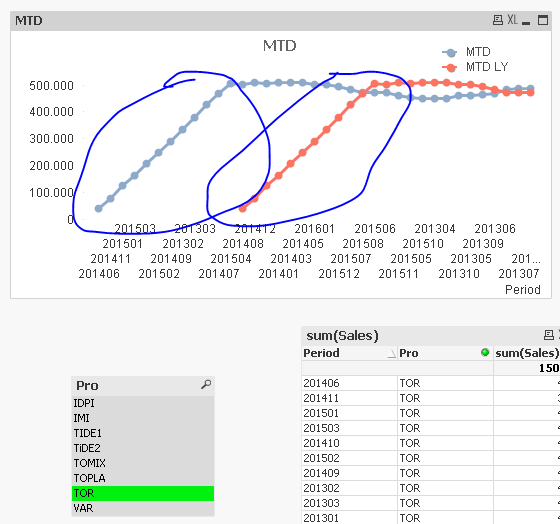
As these circled part were still accumulating. Now you won't have problem seeing the data for VAR or TOPLA
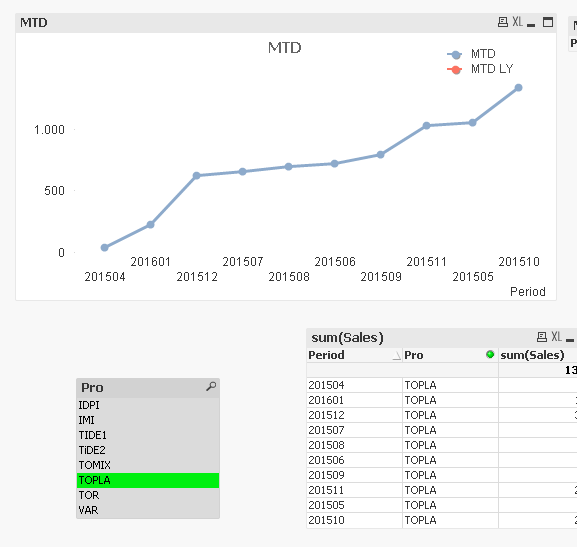
But my thinking is that this TOPLA alone might look okay, but others are not very insightful. Have a look.
- Mark as New
- Bookmark
- Subscribe
- Mute
- Subscribe to RSS Feed
- Permalink
- Report Inappropriate Content
Totally forgot about responding to the other post. What is the output you are expecting? Can you put that in an Excel file?
- Mark as New
- Bookmark
- Subscribe
- Mute
- Subscribe to RSS Feed
- Permalink
- Report Inappropriate Content
Can you check if the attached gets you to what you are trying to get?
- Mark as New
- Bookmark
- Subscribe
- Mute
- Subscribe to RSS Feed
- Permalink
- Report Inappropriate Content
Sunny, almost there.
thanks again for your support. (We are not in the same time zone, so I come to you with a bit of delay).
I changed your formula for MAT LY just a little bit
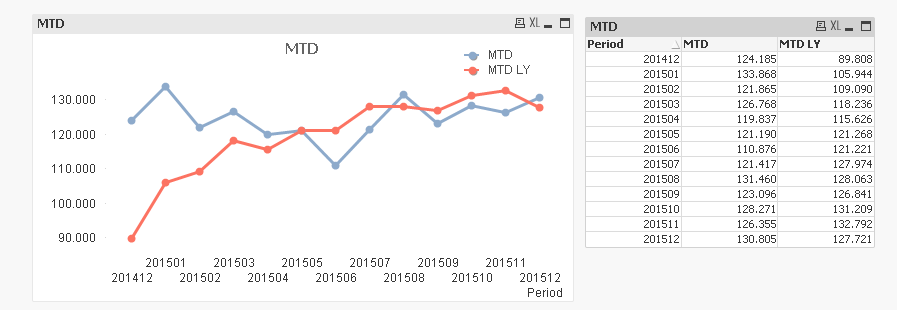
=If(RowNo() >23 , RangeSum(Above(Sum({<Quarter, Month, Period, PeriodID, Year>}Units), 12, 12)))
rather than
=If(RowNo() >23 , RangeSum(Above(Sum({<Quarter, Month, Period, PeriodID, Year>}Sales), 13, 12))).
to make it short you saved me again.
otherwise the graph doesn't adapt with the selected year...will that be hard to include in the formula ?
if 2014 is selected the max period for MAT will be 201412 and the max corresponding period LY will be 201312.
this is no big deal !
- Mark as New
- Bookmark
- Subscribe
- Mute
- Subscribe to RSS Feed
- Permalink
- Report Inappropriate Content
Actually, I have another concerned
if a product has no sales in the LY but only in the current year, then no graph is ploted at all -> no data to display.
this should be something to fix via set analysis.
The more difficult issue was the MAT that you did manage, Thanks.
can't wait to see your feedback.
thierry
- Mark as New
- Bookmark
- Subscribe
- Mute
- Subscribe to RSS Feed
- Permalink
- Report Inappropriate Content
Would you be able to point out a selection where the product had no sales LY, but has it in current year?
- Mark as New
- Bookmark
- Subscribe
- Mute
- Subscribe to RSS Feed
- Permalink
- Report Inappropriate Content
Sunny,
uploaded a more complete version version (sampleQVMAT).
you will see productsTAR, TOPLA, TOMIX for wich the problem occurs...
- Mark as New
- Bookmark
- Subscribe
- Mute
- Subscribe to RSS Feed
- Permalink
- Report Inappropriate Content
Checkin it 
- Mark as New
- Bookmark
- Subscribe
- Mute
- Subscribe to RSS Feed
- Permalink
- Report Inappropriate Content
I have put a condition so that you don't compare a 1-11 month number to a 12 month number. If I remove the conditions (RowNo > 23) you will see something like this:
As these circled part were still accumulating. Now you won't have problem seeing the data for VAR or TOPLA
But my thinking is that this TOPLA alone might look okay, but others are not very insightful. Have a look.
- Mark as New
- Bookmark
- Subscribe
- Mute
- Subscribe to RSS Feed
- Permalink
- Report Inappropriate Content
Thanks sunindia.
I had to sort the period by text ascending in order not to have periods all mixing.
for me it's acceptable to have first 12 months cumulative sales increasing before the first complete MAT.
Which is important is that for the minimum 12 last periods the comparison is feasible and working fine. !
so again thanks !!!
- « Previous Replies
-
- 1
- 2
- Next Replies »