Unlock a world of possibilities! Login now and discover the exclusive benefits awaiting you.
- Qlik Community
- :
- All Forums
- :
- GeoAnalytics
- :
- GeoAnalytics Bubble Layers are not plotting until ...
- Subscribe to RSS Feed
- Mark Topic as New
- Mark Topic as Read
- Float this Topic for Current User
- Bookmark
- Subscribe
- Mute
- Printer Friendly Page
- Mark as New
- Bookmark
- Subscribe
- Mute
- Subscribe to RSS Feed
- Permalink
- Report Inappropriate Content
GeoAnalytics Bubble Layers are not plotting until I select the item in a filter
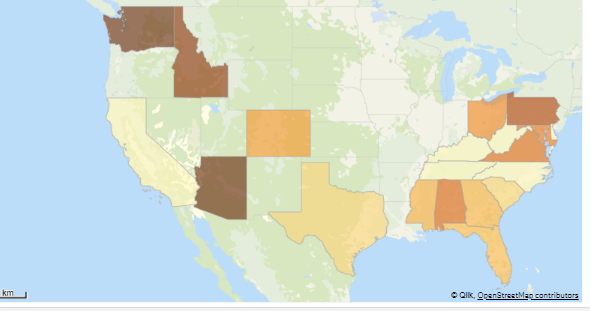
Hello, my bubbles are not plotting to my map until I select a specific record within my filter associated with the bubble. Any thoughts here? It used to work perfectly until the number of customers grew from 700 to 1,300:
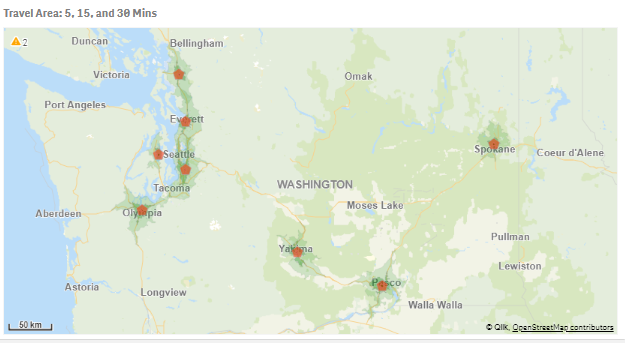
- My ID/Dimension section has a Drill from State down to the City of my locations
- My Location,Size/Measures are
- Customer Latitude
- Customer Longitude
- I restrict my drill (Layer Option) on the bubble is restricted to 1-16 (Goal: I have to select a state before I can see my customers plotted next to the store they are associated with)
Accepted Solutions
- Mark as New
- Bookmark
- Subscribe
- Mute
- Subscribe to RSS Feed
- Permalink
- Report Inappropriate Content
Hi Tim,
Check out the section "Zooming and panning in large point datasets" in the user guide.
Also download and try out the example "Select Visible example" at
https://bi.idevio.com/products/idevio-maps-for-qlik-sense/qlik-sense-2
Thanks,
Patric
- Mark as New
- Bookmark
- Subscribe
- Mute
- Subscribe to RSS Feed
- Permalink
- Report Inappropriate Content
May be this helps:
- Mark as New
- Bookmark
- Subscribe
- Mute
- Subscribe to RSS Feed
- Permalink
- Report Inappropriate Content
This one too:
- Mark as New
- Bookmark
- Subscribe
- Mute
- Subscribe to RSS Feed
- Permalink
- Report Inappropriate Content
I increased the maximum number of objects to display from 1K to 10K. That did not work. I then found this video on "Select By Visible", but it does not show how to implement:
- Mark as New
- Bookmark
- Subscribe
- Mute
- Subscribe to RSS Feed
- Permalink
- Report Inappropriate Content
I did one additional test...I changed my SQL for the customer to return the top 50 customers, rather than the 1300 I have. 15 customers plotted, and the other customers only appeared when I filtered on them...:-(
- Mark as New
- Bookmark
- Subscribe
- Mute
- Subscribe to RSS Feed
- Permalink
- Report Inappropriate Content
Hi Timothy,
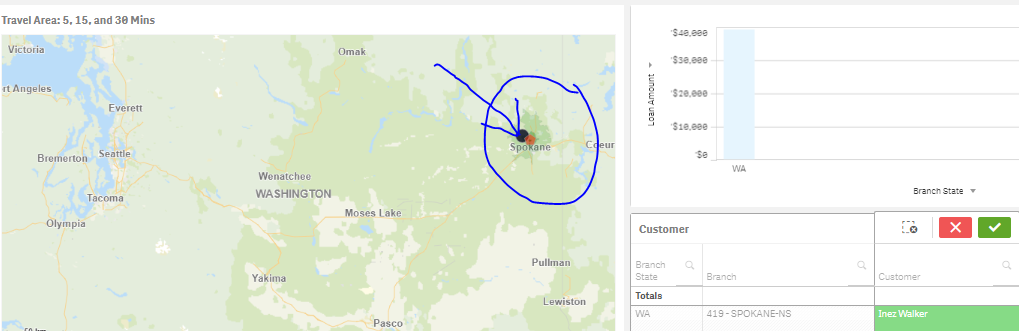
The dimension controls the of objects on the map, use Customer to see one bubble per customer and City to get a bubble per City.
Also note, City becomes an aggregation so use avg(Customer Latitude), avg(Customer Longitude) to make the location evaluate on City level. This is why the bubble only shows when one customer is selected.
Thanks,
Patric
- Mark as New
- Bookmark
- Subscribe
- Mute
- Subscribe to RSS Feed
- Permalink
- Report Inappropriate Content
Hi Patric, I found this video you shared with someone a few years ago. Do you have details on how to implement it? This would solve my initial issue:
"Select By Visible": IdevioMaps and large point datasets - YouTube
- Mark as New
- Bookmark
- Subscribe
- Mute
- Subscribe to RSS Feed
- Permalink
- Report Inappropriate Content
Hi Tim,
Check out the section "Zooming and panning in large point datasets" in the user guide.
Also download and try out the example "Select Visible example" at
https://bi.idevio.com/products/idevio-maps-for-qlik-sense/qlik-sense-2
Thanks,
Patric