Unlock a world of possibilities! Login now and discover the exclusive benefits awaiting you.
- Qlik Community
- :
- All Forums
- :
- GeoAnalytics
- :
- GeoAnalytics Info-Bubble Problem
- Subscribe to RSS Feed
- Mark Topic as New
- Mark Topic as Read
- Float this Topic for Current User
- Bookmark
- Subscribe
- Mute
- Printer Friendly Page
- Mark as New
- Bookmark
- Subscribe
- Mute
- Subscribe to RSS Feed
- Permalink
- Report Inappropriate Content
GeoAnalytics Info-Bubble Problem
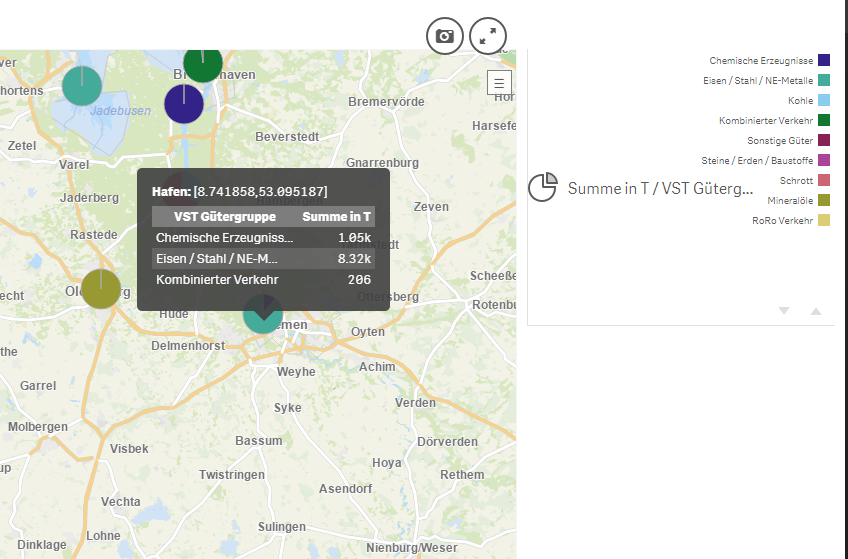
If i use a Geo-Point as Dimension the Info Bubble shows the Value in my case the Longitude and Latitude of the Point (using a Chart-Layer) but i don´t want to see the Longitude and Latitude, i want to see the Description of this Point. In My case the name of the Port.

My first solution was to use a custom info bubble but in Custom info bubble there is now known way to display a table as you see in the screenshot above.
Any ideas?
Best Regards,
Ramon
Accepted Solutions
- Mark as New
- Bookmark
- Subscribe
- Mute
- Subscribe to RSS Feed
- Permalink
- Report Inappropriate Content
Hi,
There is no magic way for multi values when doing custom info popups.
In this case either use concat or a set expression to handle aggregations.
='Partgroup 1 = ' & Sum({$<Partgroup={1}>}goods) & ' t<br> ' &
'Partgroup 2 = ' & Sum({$<Partgroup={2}>}goods) & ' t<br> '
Thanks,
Patric
- Mark as New
- Bookmark
- Subscribe
- Mute
- Subscribe to RSS Feed
- Permalink
- Report Inappropriate Content
Hi,
You can embed HTML tags to your custom info bubble to format the output.
='<table><tr><td>'&Port_name&'</td><td>'&Port_desc&'</td></tr></table>'
Thanks,
Patric
- Mark as New
- Bookmark
- Subscribe
- Mute
- Subscribe to RSS Feed
- Permalink
- Report Inappropriate Content
Hi Patric,
thank you for your fast answer. That worked but if i have more than 1 value i can not use html because the table in html is static and the Pie Chart has variable Rows.
for example:
Port: Amsterdamm
Partgroup 1 = 80 t
Partgroup 2 = 22 t
Partgroup 3 = 50 t
Qlik do this when the info bubble is set to automatic i need the whay to do so with the custom info bubble.
Best Regards,
Ramon
- Mark as New
- Bookmark
- Subscribe
- Mute
- Subscribe to RSS Feed
- Permalink
- Report Inappropriate Content
Hi,
There is no magic way for multi values when doing custom info popups.
In this case either use concat or a set expression to handle aggregations.
='Partgroup 1 = ' & Sum({$<Partgroup={1}>}goods) & ' t<br> ' &
'Partgroup 2 = ' & Sum({$<Partgroup={2}>}goods) & ' t<br> '
Thanks,
Patric