Unlock a world of possibilities! Login now and discover the exclusive benefits awaiting you.
- Qlik Community
- :
- All Forums
- :
- Integration, Extension & APIs
- :
- Is there any way to inscribe a "connection map" in...
- Subscribe to RSS Feed
- Mark Topic as New
- Mark Topic as Read
- Float this Topic for Current User
- Bookmark
- Subscribe
- Mute
- Printer Friendly Page
- Mark as New
- Bookmark
- Subscribe
- Mute
- Subscribe to RSS Feed
- Permalink
- Report Inappropriate Content
Is there any way to inscribe a "connection map" into the app development program of Qlik?
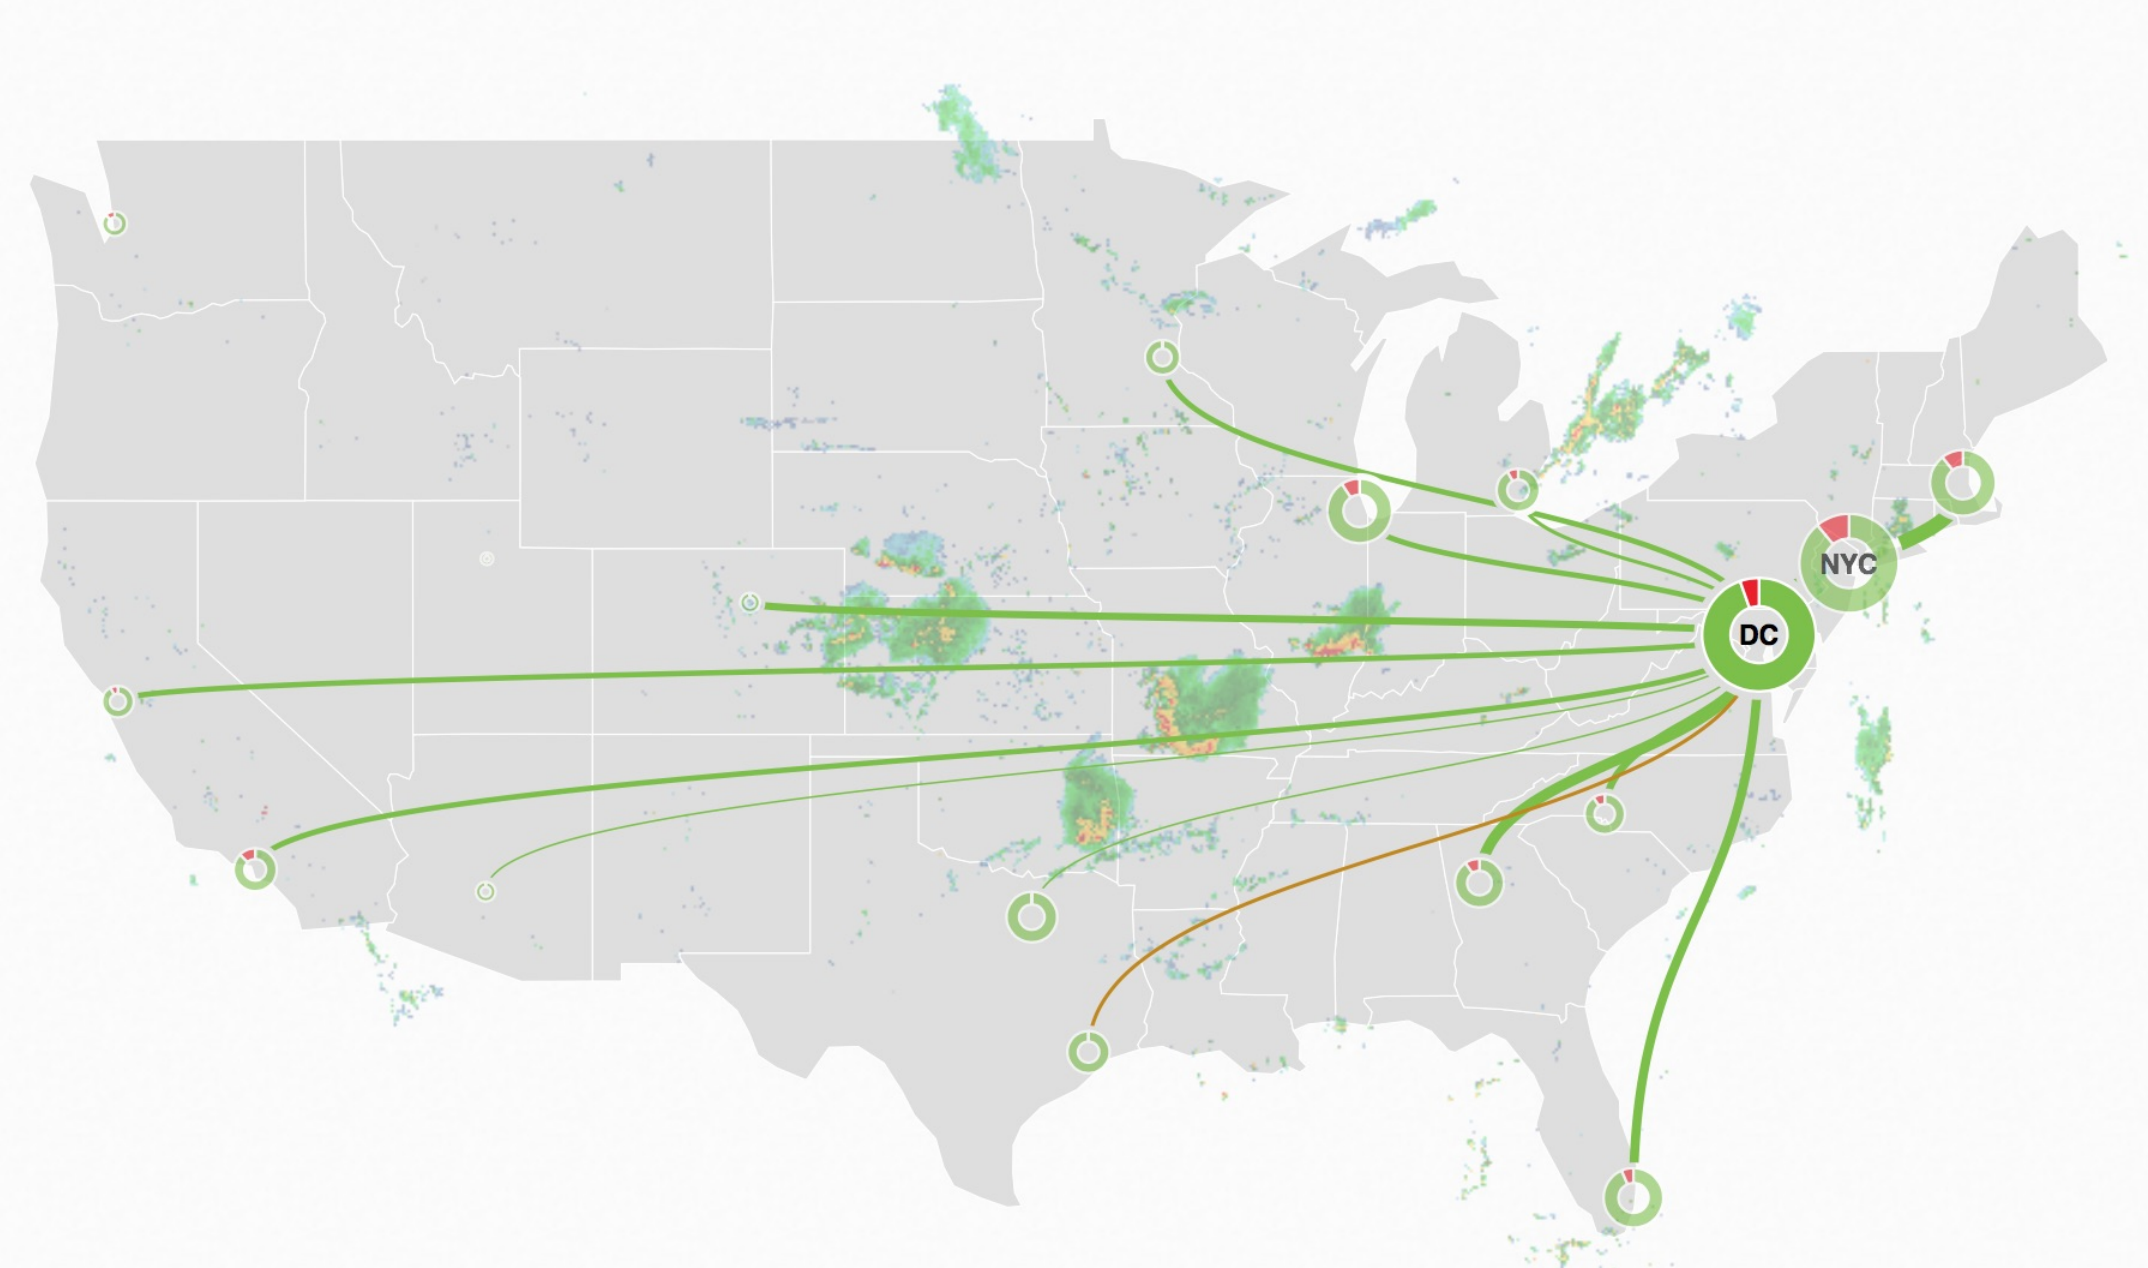
This map here is basically what I am going for. It looks like a Qlik map, just looking for more information on how to go about installing these graphics with our own coordinates and interactive capabilities. Any help is appreciated! Thanks.

- Mark as New
- Bookmark
- Subscribe
- Mute
- Subscribe to RSS Feed
- Permalink
- Report Inappropriate Content
Hi Forrest,
Your question is : how can i implement this kind of map inside Qlik Sense ?
From my point of view Qlik Sense can't make those kinds of map with default map, you can only create a map with one layer : Filling (gradient color) or Symbol (proportionnal).
You will need an extension that allows you to create several layer with different representation.
As far as i can see you have 4 layers :
- Filling for the state
- Proportionnal Pie chart for the city
- Flow between those cities
- Heatmap or more like a wms layer on the top of the map
I know one extension that can help you to create this map but it's not a free tool : Articque MAP
http://www.articque.com/articque-map-for-qlikview-and-qliksense/
It exists other extension like : QlikMaps or GeoQlik.
But for your need you must use an extension or create it yourself.
Regards,
Thibaut