Unlock a world of possibilities! Login now and discover the exclusive benefits awaiting you.
- Qlik Community
- :
- All Forums
- :
- Integration, Extension & APIs
- :
- Re: New KPI extension released for Qlik Sense - Cl...
- Subscribe to RSS Feed
- Mark Topic as New
- Mark Topic as Read
- Float this Topic for Current User
- Bookmark
- Subscribe
- Mute
- Printer Friendly Page
- Mark as New
- Bookmark
- Subscribe
- Mute
- Subscribe to RSS Feed
- Permalink
- Report Inappropriate Content
New KPI extension released for Qlik Sense - Climber KPI
Introducing the Climber KPI extension for Qlik Sense

The Climber KPI is fully responsive and works for all screen sizes. Features include background trends for both actual and target, navigation and tooltip on hover to show values. Colors are completely flexible but have good standard settings to allow quick and easy creation of nice looking KPIs.
Climber KPI on Qlik Branch:
http://branch.qlik.com/#!/project/590b019a62613387afdeea34?status=created
Direct link to github:
The large number of options for the layout including the possibility to use an image background allows a flexible layout. Finetuning of graphs, colors and even margins are possible in the extensive settings menu.

Best regards
Karl Fredberg Sjöstrand
Senior Business Intelligence Consultant
Climber AB, Stockholm
Check out our previously released extensions
Self service without edit-mode for Qlik Sense! A customizable straight table.

Horizontal selection bar with initial selection capabilities. Selections through both click and swipes.
Table extension with cards as cells, developed for showcasing items with images. Responsive design and selection enabled, both click and swipes. Multiple layout options and Select and Go To Sheet mode
- « Previous Replies
- Next Replies »
- Mark as New
- Bookmark
- Subscribe
- Mute
- Subscribe to RSS Feed
- Permalink
- Report Inappropriate Content
It looks good and well-featured. But i can see you've only provided minified built artefacts on GitHub, not source code. This means it's not supportable long term, since we won't be able to make changes with Qlik updates.
This is a shame, it seems a good extension.
- Mark as New
- Bookmark
- Subscribe
- Mute
- Subscribe to RSS Feed
- Permalink
- Report Inappropriate Content
Sometimes a little bit better comes at a little bit of cost ;-). Jokes aside, we do offer support via subscription for all customers for this extension as well as our other extensions on Branch. We will keep our Branch extensions updated to work with later versions too so you will probably be ok to use it, but of course if you want to use an extension in a critical application you should always look for someone to offer support and some kind of SLA.
- Mark as New
- Bookmark
- Subscribe
- Mute
- Subscribe to RSS Feed
- Permalink
- Report Inappropriate Content
does the export function work for this?
- Mark as New
- Bookmark
- Subscribe
- Mute
- Subscribe to RSS Feed
- Permalink
- Report Inappropriate Content
I see the export property is turned on but it doesn't work when I try it
- Mark as New
- Bookmark
- Subscribe
- Mute
- Subscribe to RSS Feed
- Permalink
- Report Inappropriate Content
Yes,
export should work.
Please report any issues you find to our GitHub page https://github.com/ClimberAB/ClimberKPI (Or of course email our support if you are a paying customer.)
Kind regards
Michael
- Mark as New
- Bookmark
- Subscribe
- Mute
- Subscribe to RSS Feed
- Permalink
- Report Inappropriate Content
Hi Karl,
Experimenting with Climber KPI at the moment.
The KPI setup I currently have has Current Month and the Secondary is Rolling Average(6mo) and then with a trend line (graph) underneath. I tried using climber KPI to have the embedded graph behind but because I have locked the date on both measures it does not function.
Is there any way round this that you know of?
- Mark as New
- Bookmark
- Subscribe
- Mute
- Subscribe to RSS Feed
- Permalink
- Report Inappropriate Content
Great, thank you
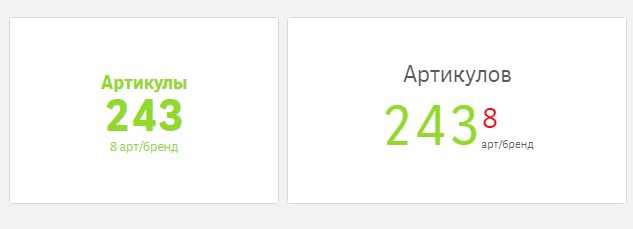
1. Would be great to be able to fill the object (currently the white borders are too big)
2. Would be great to color KPI and it's label separately
Climber vs. Standard Qlik Sense extension:

- Mark as New
- Bookmark
- Subscribe
- Mute
- Subscribe to RSS Feed
- Permalink
- Report Inappropriate Content
Hi,
In the KPI extension settings under appearance you can set both the margin (None/Default/Large) and the font size (S/M/L) to adjust the way it looks.
Michael
- Mark as New
- Bookmark
- Subscribe
- Mute
- Subscribe to RSS Feed
- Permalink
- Report Inappropriate Content
Hi,
Thanks for the great job! It's a very useful extension I use in many of my apps.
Quick question: is there any way to change the target percentage that will show? For example, showing a coverage or realization instead of growth.
I see it always shows growth, which is great when you compare something in different time periods, but it's not very meaningful when you try to see something like sales against budget, where a direct percentage would be the way to go. A/B instead of (A/B)-1.
I don't know if this is the right place to ask, if not, please refer me where I should!
Thanks!
- « Previous Replies
- Next Replies »