Unlock a world of possibilities! Login now and discover the exclusive benefits awaiting you.
- Qlik Community
- :
- All Forums
- :
- Integration, Extension & APIs
- :
- Re: New KPI extension released for Qlik Sense - Cl...
- Subscribe to RSS Feed
- Mark Topic as New
- Mark Topic as Read
- Float this Topic for Current User
- Bookmark
- Subscribe
- Mute
- Printer Friendly Page
- Mark as New
- Bookmark
- Subscribe
- Mute
- Subscribe to RSS Feed
- Permalink
- Report Inappropriate Content
New KPI extension released for Qlik Sense - Climber KPI
Introducing the Climber KPI extension for Qlik Sense

The Climber KPI is fully responsive and works for all screen sizes. Features include background trends for both actual and target, navigation and tooltip on hover to show values. Colors are completely flexible but have good standard settings to allow quick and easy creation of nice looking KPIs.
Climber KPI on Qlik Branch:
http://branch.qlik.com/#!/project/590b019a62613387afdeea34?status=created
Direct link to github:
The large number of options for the layout including the possibility to use an image background allows a flexible layout. Finetuning of graphs, colors and even margins are possible in the extensive settings menu.

Best regards
Karl Fredberg Sjöstrand
Senior Business Intelligence Consultant
Climber AB, Stockholm
Check out our previously released extensions
Self service without edit-mode for Qlik Sense! A customizable straight table.

Horizontal selection bar with initial selection capabilities. Selections through both click and swipes.
Table extension with cards as cells, developed for showcasing items with images. Responsive design and selection enabled, both click and swipes. Multiple layout options and Select and Go To Sheet mode
- Mark as New
- Bookmark
- Subscribe
- Mute
- Subscribe to RSS Feed
- Permalink
- Report Inappropriate Content
Great suggestion!
Please post as an issue here https://github.com/ClimberAB/ClimberKPI/issues
- Mark as New
- Bookmark
- Subscribe
- Mute
- Subscribe to RSS Feed
- Permalink
- Report Inappropriate Content
Great! Thank you, I sure will!
- Mark as New
- Bookmark
- Subscribe
- Mute
- Subscribe to RSS Feed
- Permalink
- Report Inappropriate Content
Designed with great taste, Very Useful Extension.
One Issue - A Right to Left Option Would be Appreciated.
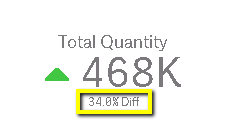
See attached Example - The Percentage in brackets should Be to the Left Of the Text instead of to the right.
Regards.
Motty
- Mark as New
- Bookmark
- Subscribe
- Mute
- Subscribe to RSS Feed
- Permalink
- Report Inappropriate Content
Thanks for the kind feedback and good to know there are requests for right-to-left. We will consider it for future releases depending on the needs of our subscribing customers.
- Mark as New
- Bookmark
- Subscribe
- Mute
- Subscribe to RSS Feed
- Permalink
- Report Inappropriate Content
Hi michael.nordstrom ,
How is it possible to define a conditional color for a second measure defined?
Thanks for sharing this useful extension!

- Mark as New
- Bookmark
- Subscribe
- Mute
- Subscribe to RSS Feed
- Permalink
- Report Inappropriate Content
Hi,
at the bottom of the color settings there is an option for "Other colors mode" That will change the basic text color including the color for the second measure. We realize you may want further options and we are considering how to best include that in future versions.
Michael
- Mark as New
- Bookmark
- Subscribe
- Mute
- Subscribe to RSS Feed
- Permalink
- Report Inappropriate Content
Hi Michael,
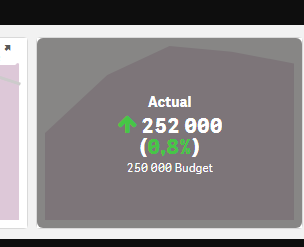
I saw this example of yours. How is it achieved?
Thanks!

- Mark as New
- Bookmark
- Subscribe
- Mute
- Subscribe to RSS Feed
- Permalink
- Report Inappropriate Content
Hi Dafnis,
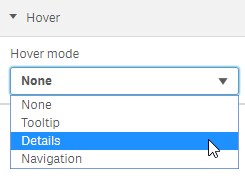
that is the hover setting that decides what is show. You find it under appearence/hover. Set it to "Details" and the gray background with additional comparison details will appear on mouse over.

- Mark as New
- Bookmark
- Subscribe
- Mute
- Subscribe to RSS Feed
- Permalink
- Report Inappropriate Content
Hi Michael,
In the example above is it possible to set an upper limit to the target budget? How is it done?
The reason I ask is that I am comparing a current percentage to a historic one. Sometimes the historic percentage calculation is erroneous and shows a value of over 100% (say 108%). When the target is above 100% then even if the current value is 100% it is perceived as a decrease compared to the historic percentage.
Thanks so much!
- Mark as New
- Bookmark
- Subscribe
- Mute
- Subscribe to RSS Feed
- Permalink
- Report Inappropriate Content
Anyone else experiencing that only the chart shows but the actual KPI (the number part) is not visible?
I am using v1.6.2 of the extension on Qlik Sense Feb 2019 SP1.
I noticed that if I resize the object (making it longer), the KPI text quickly shows at the bottom of the KPI and quickly disappears again, so my guess is it has to do with the part of the script that decides the positioning of the text.

Picture show before, during and after resize.