Unlock a world of possibilities! Login now and discover the exclusive benefits awaiting you.

- Qlik Community
- :
- Forums
- :
- Analytics & AI
- :
- Products & Topics
- :
- Integration, Extension & APIs
- :
- Re: Pivot table with visualization API
- Subscribe to RSS Feed
- Mark Topic as New
- Mark Topic as Read
- Float this Topic for Current User
- Bookmark
- Subscribe
- Mute
- Printer Friendly Page

 _jespers_
- Mark as New
- Bookmark
- Subscribe
- Mute
- Subscribe to RSS Feed
- Permalink
- Report Inappropriate Content
Pivot table with visualization API
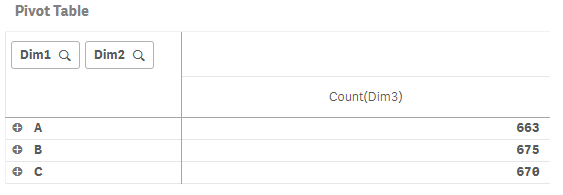
Is there any way that I can get the second dimension to be in the column section per default with the visualization API for the pivot-table component so it looks like this?

Because using the following code is only stacking the dimensions in the rows:
app.visualization.create(
                  'pivot-table',
                  [
                    {
                      "qDef": {
                        "qFieldDefs": [
                          "Dim1"
                        ],
                        "qFieldLabels": [
                          "Dim1"
                        ]
                      },
                      "qNullSuppression": true
                    },
                    {
                      "qDef": {
                        "qFieldDefs": [
                          "Dim2"
                        ],
                        "qFieldLabels": [
                          "Dim2"
                        ]
                      },
                      "qNullSuppression": true
                    },
                    {
                      "qDef": {
                        "qLabel": "Count(Dim3)",
                        "qDef": "Count(Dim3)",
                        "qNumFormat": {
                          "qType": "F",
                          "qnDec": 0,
                          "qUseThou": 0,
                          "qFmt": "# ##0",
                          "qDec": ".",
                          "qThou": ","
                        }
                      }
                    }
                  ],
                  {
                    "showTitles": true,
                    "title": "Pivot Table"
                  }
                ).then(function(vis){
                    vis.show("QV01");
                });
Accepted Solutions

 ErikWetterberg
- Mark as New
- Bookmark
- Subscribe
- Mute
- Subscribe to RSS Feed
- Permalink
- Report Inappropriate Content
Hi,
You should be able to set qNoOfLeftDims as described in the Engine API:
https://help.qlik.com/en-US/sense-developer/June2018/apis/EngineAPI/definitions-HyperCubeDef.html
Erik Wetterberg
ErikWetterberg
- Mark as New
- Bookmark
- Subscribe
- Mute
- Subscribe to RSS Feed
- Permalink
- Report Inappropriate Content
Hi,
You should be able to set qNoOfLeftDims as described in the Engine API:
https://help.qlik.com/en-US/sense-developer/June2018/apis/EngineAPI/definitions-HyperCubeDef.html
Erik Wetterberg
_jespers_
- Mark as New
- Bookmark
- Subscribe
- Mute
- Subscribe to RSS Feed
- Permalink
- Report Inappropriate Content
Hi Erik,
Yes, that worked! Thank you!
If anyone is interested in what changes I did it is in the options where I added the "qHyperCubeDef":
app.visualization.create(
                  'pivot-table',
                  [
                    {
                      "qDef": {
                        "qFieldDefs": [
                          "Dim1"
                        ],
                        "qFieldLabels": [
                          "Dim1"
                        ]
                      },
                      "qNullSuppression": true
                    },
                    {
                      "qDef": {
                        "qFieldDefs": [
                          "Dim2"
                        ],
                        "qFieldLabels": [
                          "Dim2"
                        ]
                      },
                      "qNullSuppression": true
                    },
                    {
                      "qDef": {
                        "qLabel": "Count(Dim3)",
                        "qDef": "Count(Dim3)",
                        "qNumFormat": {
                          "qType": "F",
                          "qnDec": 0,
                          "qUseThou": 0,
                          "qFmt": "# ##0",
                          "qDec": ".",
                          "qThou": ","
                        }
                      }
                    }
                  ],
                  {
                    "qHyperCubeDef":{
                         "qNoOfLeftDims": 1
                    },
                    "showTitles": true,
                    "title": "Pivot Table"
                  }
                ).then(function(vis){
                    vis.show("QV01");
                });

 09999
09999
- Mark as New
- Bookmark
- Subscribe
- Mute
- Subscribe to RSS Feed
- Permalink
- Report Inappropriate Content
HI Eric,
I am trying to build something as you did . Progmatically I want to set what columns should be in pivot. For some reason I am not able to get it working. Any other things that I need to set for qNoOfLeftDims to work? below is the code. I see pivot table rendering but all dimensions are on left. Ideally in below example I want "year" to be at top i.e. column grouped by year.
let pro = {
"qHyperCubeDef": {
"qDimensions": [{
"qDef": {
"qFieldDefs": ["Company"],
"qFieldLabels": ["Company"]
}
},
{
"qDef": {
"qFieldDefs": ["Company Name"],
"qFieldLabels": ["Company Name"]
}
},
{
"qDef": {
"qFieldDefs": ["Year"],
"qFieldLabels": ["Year"]
}
}],
"qMeasures": [{
"qDef": {
"qDef": "Sum([Quantity])",
"qLabel": "QUantity TOtal",
"qNumFormat": {
"qType": "F",
"qnDec": 0,
"qUseThou": 1,
"qFmt": "#,##0",
"qDec": ".",
"qThou": ","
}
}
}],
"qNoOfLeftDims": 2,
}
}
qlikApp.visualization.create('pivot-table', null, pro)
.then(function (reply) {
reply.show('vis' + favVisual.id);
});
