Unlock a world of possibilities! Login now and discover the exclusive benefits awaiting you.
- Qlik Community
- :
- Forums
- :
- Analytics & AI
- :
- Products & Topics
- :
- Integration, Extension & APIs
- :
- Re: Qlik Sense Visualization API - How to set cell...
- Subscribe to RSS Feed
- Mark Topic as New
- Mark Topic as Read
- Float this Topic for Current User
- Bookmark
- Subscribe
- Mute
- Printer Friendly Page
- Mark as New
- Bookmark
- Subscribe
- Mute
- Subscribe to RSS Feed
- Permalink
- Report Inappropriate Content
Qlik Sense Visualization API - How to set cell attributes
Hi everyone,
Could anyone tell me how to use the setOptions method of the visualization API (setOptions method ‒ Qlik Sense Developers) to set the attributes of a dimension?
The following code can be used to change title, subtitle and footnote:
app.visualization.get(strQID).then(function(vis){

  console.log('vis',vis);

  vis.setOptions(
  {
  //orientation:"vertical"
  title:"New title",
  subtitle:"New subtitle",
  footnote:"New footnote"
  });
According to the help, I should be able to set all of these properties: http://help.qlik.com/en-US/sense-developer/September2017/Subsystems/APIs/Content/CapabilityAPIs/Visu...
, but the example is rather simplistic and doesn't cover how to interact with the attributes.
Thanks in advance.
- Tags:
- qlik sense apis
- « Previous Replies
-
- 1
- 2
- Next Replies »
Accepted Solutions
- Mark as New
- Bookmark
- Subscribe
- Mute
- Subscribe to RSS Feed
- Permalink
- Report Inappropriate Content
Eureka! I got it to work with the table by replacing the qDef with the qExpression property, so it now looks like this:
if(strQID=='ueBFGP')
{
vis.setOptions(
{

title:"New title",
subtitle:"New subtitle",
footnote:"New footnote",


qHyperCubeDef:
{
qDimensions:
{
0: {
qDef: {autoSort:false} ,
"qAttributeExpressions":
[
{
  "id": "cellBackgroundColor",
  "qExpression":"=Red()"
}
]
}
}
}
});
}
- Mark as New
- Bookmark
- Subscribe
- Mute
- Subscribe to RSS Feed
- Permalink
- Report Inappropriate Content
Hi Rickard,
You'll probably have to experiment with this, but the principle is that you should provide an object, something like this:
vis.setOptions({
  qHyperCubeDef:{
     qDimensions:[{
        qDef: {autoSort:false}
      }]
  }
});
Just make an object with the properties you want to change, omitting the ones you don't want to change. SetOptions wraps applyPatches, and convertes the object to a patch array, that is eventually sent to engine.
I must admit I haven't tried this for a long time though, so I haven't verified that this actually works. Hope you find it helpful anyhow.
Erik Wetterberg
- Mark as New
- Bookmark
- Subscribe
- Mute
- Subscribe to RSS Feed
- Permalink
- Report Inappropriate Content
Hi Erik,
Thanks for your response. Unfortunately, the autosort raises an error (I only tried this with a pivot-table visualization, which includes the autoSort property, so it's not a case of the wrong type):
require.js:19 TypeError: Cannot read property 'qError' of undefined
at http://....../resources/js/qlik.js:106:22645
at Array.map (native)
at http://....../resources/js/qlik.js:106:22581
at g (http://....../resources/assets/external/requirejs/require.js:20:2335)
at http://....../resources/assets/external/requirejs/require.js:20:2507
at o.$eval (http://....../resources/assets/external/requirejs/require.js:20:10136)
at o.$digest (http://....../resources/assets/external/requirejs/require.js:20:8622)
at http://....../resources/assets/external/requirejs/require.js:20:10223
at f (http://....../resources/assets/external/requirejs/require.js:18:20514)
at http://....../resources/assets/external/requirejs/require.js:18:21973
Any ideas?
Here's the code:
app.visualization.get(strQID).then(function(vis){
  if(strQID=='ueBFGP')
  {
  vis.setOptions(
  {

  title:"New title",
  subtitle:"New subtitle",
  footnote:"New footnote",
  qHyperCubeDef:
  {
  qDimensions:[{
  qDef: {autoSort:false}
  }]
  }
  });
  }
});
- Mark as New
- Bookmark
- Subscribe
- Mute
- Subscribe to RSS Feed
- Permalink
- Report Inappropriate Content
Hi,
The problem could be that it tries to replace the entire qDimensions array, which gives an error, that is not handled well, but breaks.
Try this:
vis.setOptions({
qHyperCubeDef:{
  qDimensions:{
     0: {qDef: {autoSort:false}}
  }
}
});
If you want to modify the first dimension.
And I'm sorry, I haven't tried this, I'll leave that to you...
Erik Wetterberg
- Mark as New
- Bookmark
- Subscribe
- Mute
- Subscribe to RSS Feed
- Permalink
- Report Inappropriate Content
Hi Erik,
Yes, this works, thanks. I am now trying to work out how to set use the cellBackgroundColor option.
if(strQID=='ueBFGP')
{
vis.setOptions(
{

title:"New title",
subtitle:"New subtitle",
footnote:"New footnote",


qHyperCubeDef:
{
qDimensions:
{
0: {
qDef: {autoSort:false} ,
qAttributeExpressions:
[
{

  "qDef": "Product (Production)",
  "id": {"cellBackgroundColor":"=Red()"}

}
]
}
},
qMeasures:
{
0: {
qAttributeExpressions:
[
{
  "id": {cellBackgroundColor:"Red()"}
}
]
}
}
}
});
}
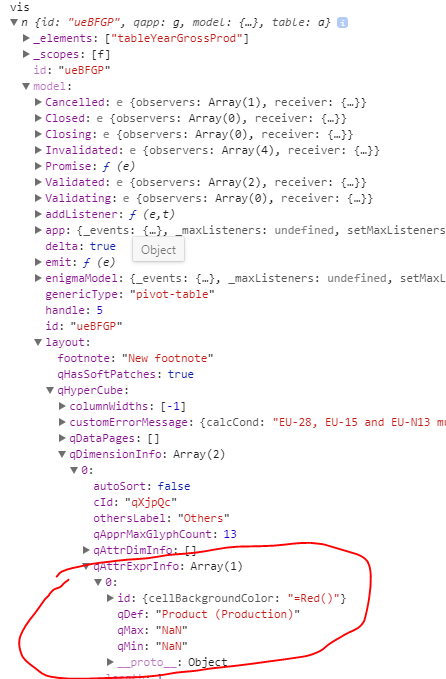
When I look at the console (see below), it seems as though this has worked, but the cell colour has not been changed. Any ideas?
- Mark as New
- Bookmark
- Subscribe
- Mute
- Subscribe to RSS Feed
- Permalink
- Report Inappropriate Content
Hi,
The format looks strange, what was it like before the change? I would expect it to be something like:
id: "cellBackgroundColor",
qDef: "=Red()"
But, really, what did it look like to start with??
Erik Wetterberg
- Mark as New
- Bookmark
- Subscribe
- Mute
- Subscribe to RSS Feed
- Permalink
- Report Inappropriate Content
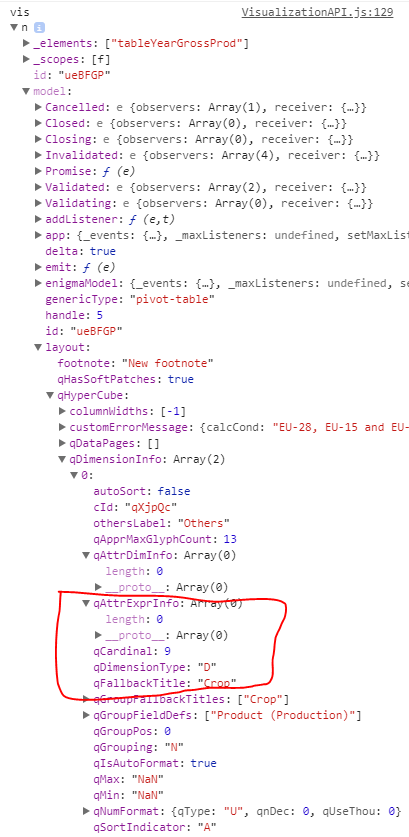
When I comment out these changes, I see the following:
- Mark as New
- Bookmark
- Subscribe
- Mute
- Subscribe to RSS Feed
- Permalink
- Report Inappropriate Content
And when I change the code to:
id: "cellBackgroundColor",
qDef: "=Red()"
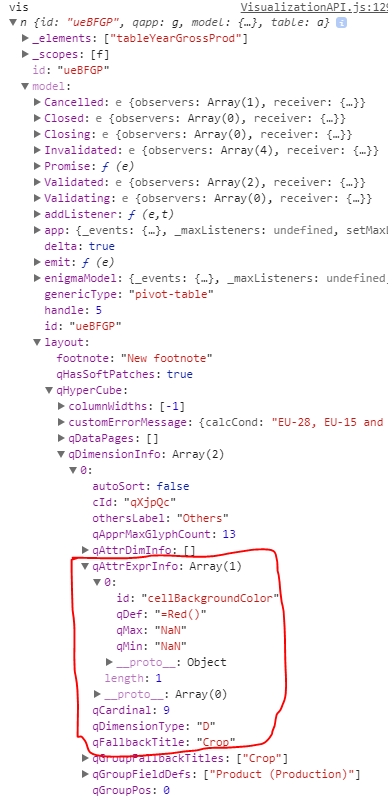
I get the following (similar to my comment of 02-Feb-2018 12:24). This still has no impact on the cell background colour.
- Mark as New
- Bookmark
- Subscribe
- Mute
- Subscribe to RSS Feed
- Permalink
- Report Inappropriate Content
And what does it look like if you set background color to red in the client?
Erik Wetterberg
- Mark as New
- Bookmark
- Subscribe
- Mute
- Subscribe to RSS Feed
- Permalink
- Report Inappropriate Content
Sorry Erik, do you mean in the Qlik Sense client, i.e. accessed through the QS hub? There's no option with the pivot table, only table.
Here's the table:
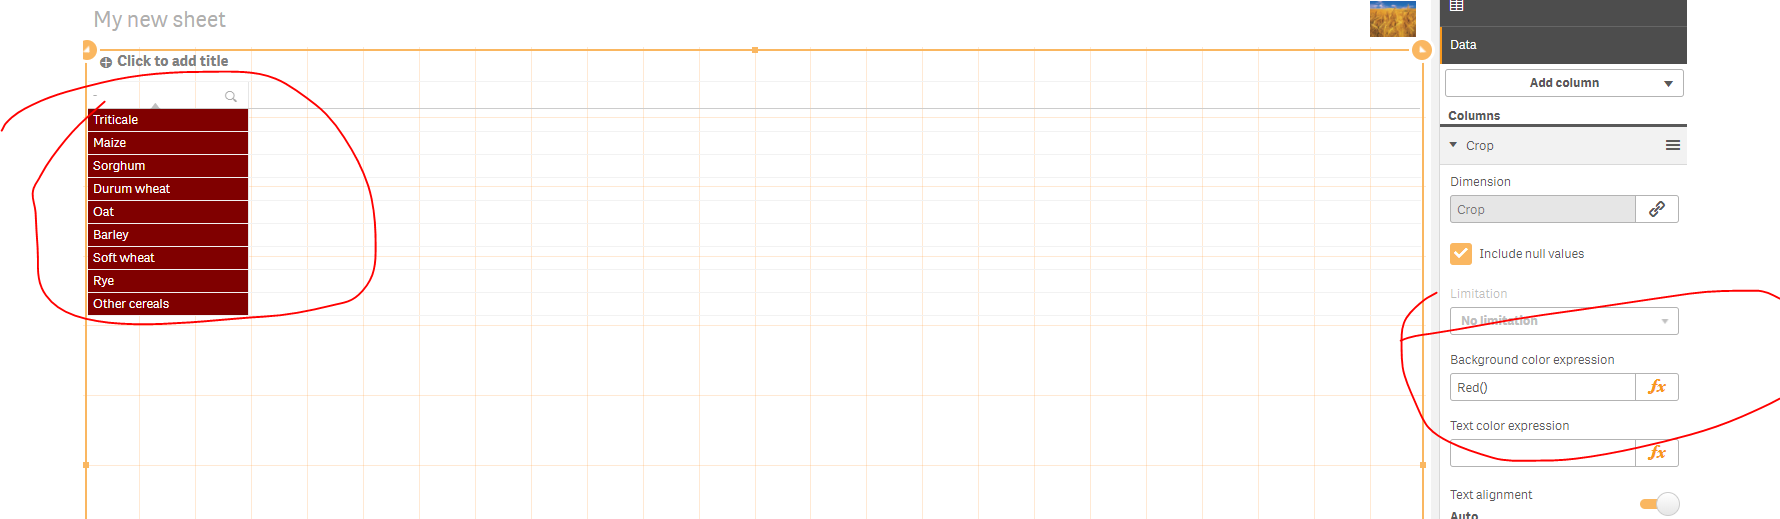
...and here's the pivot table:
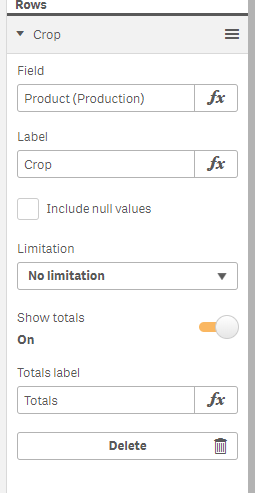
But according to Qlik Help, cellBackgroundColor should be possible to set for pivot-table too.
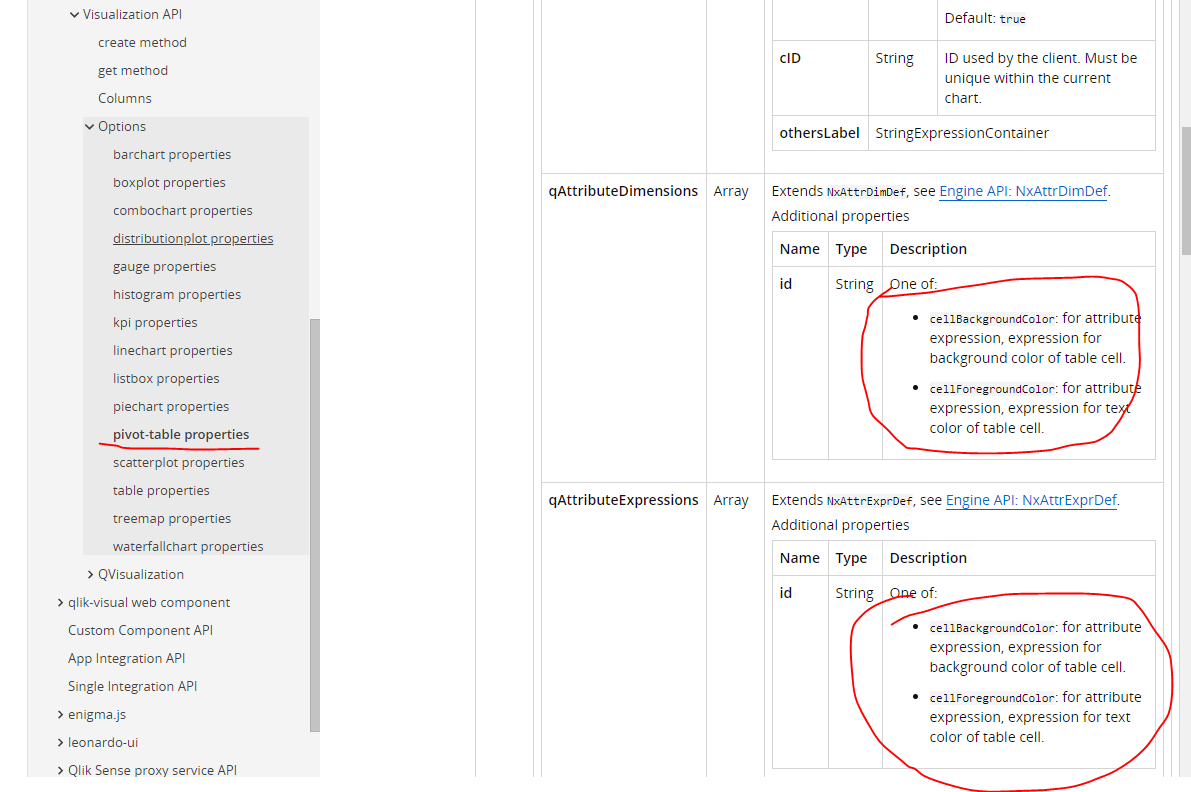
Still, I'll try it on a table and let you know what happens.
- « Previous Replies
-
- 1
- 2
- Next Replies »