Unlock a world of possibilities! Login now and discover the exclusive benefits awaiting you.
- Qlik Community
- :
- Forums
- :
- Analytics & AI
- :
- Products & Topics
- :
- Integration, Extension & APIs
- :
- Qlik Sense Visualization API - KPI
- Subscribe to RSS Feed
- Mark Topic as New
- Mark Topic as Read
- Float this Topic for Current User
- Bookmark
- Subscribe
- Mute
- Printer Friendly Page
- Mark as New
- Bookmark
- Subscribe
- Mute
- Subscribe to RSS Feed
- Permalink
- Report Inappropriate Content
Qlik Sense Visualization API - KPI
Hi,
For proprietary reasons, I am trying to load KPI charts from an existing Qlik App, using the Visualization API and showing it in an Angular cli (11) application.
The KPI loads properly. But for some reason, when I try to set options, they don't seem to work for most of them.
Before going any further, loading the chart with the iframe embbed link works ok. but that's not what I am looking for, as I need to implement custom behaviors on the parent div, and this way of loading Qlik objects hijacks the mouse events. On top of that I need to load and display like 12 of those, and would rather have one spinner than 12.
Anyway;
Given the code below:
app.visualization.get('PWpCcm').then((vis) => {
   vis.setOptions({
       showTitles: false,
       showMeasureTitle: true,
       disableNavMenu: true,
       textAlign: "center",
       layoutBehavior: 'Responsive'
   })
   vis.show('QV01');
})
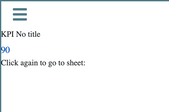
First, the chart type appears all the time ('KPI'). The measure title does not appear. 'No title' appear even though showTitles is false, Text is not centered, and it is not responsive.
The label for sheet navigation is always present also.
I would have assumed that calling an existing object would have applied all the settings that this object have in the Qlik App.
Notes:
I have tried creating a KPI on the fly, with the measure, same result.
I have treated the setOptions like a promise, same result.
The KPI chart has a master measure applied to it ( in the Qlik app).
Is there something I am not getting? or am I doing something wrong?
Thanks.
Accepted Solutions
- Mark as New
- Bookmark
- Subscribe
- Mute
- Subscribe to RSS Feed
- Permalink
- Report Inappropriate Content
I think I just answered myself.
I needed to include the qlik-styles.css in the <head>
resources/autogenerated/qlik-styles.cssnow I see what I expected.
- Mark as New
- Bookmark
- Subscribe
- Mute
- Subscribe to RSS Feed
- Permalink
- Report Inappropriate Content
I think I just answered myself.
I needed to include the qlik-styles.css in the <head>
resources/autogenerated/qlik-styles.cssnow I see what I expected.
