Unlock a world of possibilities! Login now and discover the exclusive benefits awaiting you.
- Qlik Community
- :
- Forums
- :
- Analytics & AI
- :
- Products & Topics
- :
- Integration, Extension & APIs
- :
- Re: R - Load data from RDS file
- Subscribe to RSS Feed
- Mark Topic as New
- Mark Topic as Read
- Float this Topic for Current User
- Bookmark
- Subscribe
- Mute
- Printer Friendly Page
- Mark as New
- Bookmark
- Subscribe
- Mute
- Subscribe to RSS Feed
- Permalink
- Report Inappropriate Content
R - Load data from RDS file
Hi everyone,
I'm trying to merge my work in R, with some basic Qlik dashboards. Now my first issue to read a RDS file (R dataframe export) into a table in QlikSense with this loading script :
[Feature_importance]:
Load
	Feature,
	Num(Gain) as Gain,
	Num(Cover) as Couverture,
	Num(Frequency) as Frequence
Extension R.ScriptEval('library(dplyr);
						data <- readRDS("C:/path/feature_importance.RDS");
                        col.types <- sapply(data, class);
                        print(col.types);
                        data[, c("Feature", "Gain", "Cover", "Frequency")];');
My problem is that every feature is read as a string, but I would like to display and format them as numerics in my dashboard tables. Using Num() in script did not change this.
The printed col.types for my data.frame are :
Feature : Char
Gain : Numeric
Cover : Numeric
Frequency : Numeric
- Mark as New
- Bookmark
- Subscribe
- Mute
- Subscribe to RSS Feed
- Permalink
- Report Inappropriate Content
Hi Alexbec,
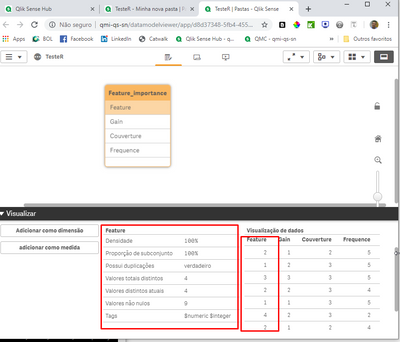
Qlik will receive the data type from R, so since the Feature field is a Char data type, Qlik will use this same type, even its content has numbers.
Well, to avoid that you must transform this column directly on R, recommend to use a Factor data type, cause Qlik will recognize it with a number, even there is a number.
And recommend also ever end your with the data frame display you want to send to Qlik to avoid data transport mistakes.
Follow my code:
[Feature_importance]:
Load
	Feature,
	Num(Gain) as Gain,
	Num(Cover) as Couverture,
	Num(Frequency) as Frequence
Extension R.ScriptEval('library(dplyr);
	data <- readRDS("C:/path/feature_importance.RDS");
        col.types <- sapply(data, class);
        print(col.types);
        data[, c("Feature", "Gain", "Cover", "Frequency")];
        data$Feature = as.factor(data$Feature);
        str(data);
        data;
        ');
Follow my table on Qlik:
Follow the RServe display:
Good luck,
Pedro
- Mark as New
- Bookmark
- Subscribe
- Mute
- Subscribe to RSS Feed
- Permalink
- Report Inappropriate Content
Hello!
Does anyone have a test .rds file that I can share to understand a little better what it is about and learn how to do this type of data reading?

