Unlock a world of possibilities! Login now and discover the exclusive benefits awaiting you.
- Qlik Community
- :
- Forums
- :
- Analytics
- :
- New to Qlik Analytics
- :
- Re: Active employee count for specific year
- Subscribe to RSS Feed
- Mark Topic as New
- Mark Topic as Read
- Float this Topic for Current User
- Bookmark
- Subscribe
- Mute
- Printer Friendly Page
- Mark as New
- Bookmark
- Subscribe
- Mute
- Subscribe to RSS Feed
- Permalink
- Report Inappropriate Content
Active employee count for specific year
Hello,
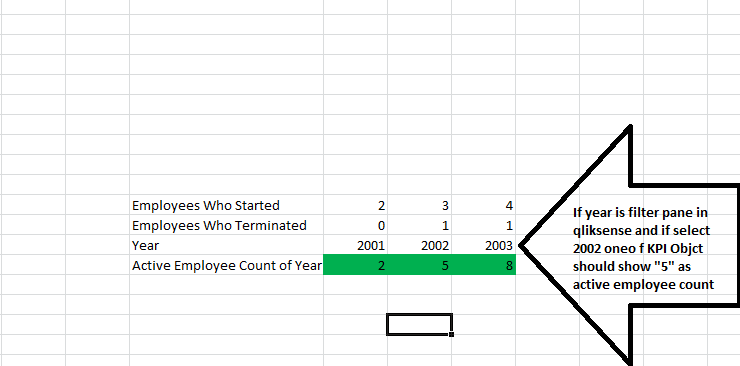
I have count of people who are starting and who are terminating year wise. I want the active employee count as per the year if I select year from filter pane. Please find attached image for more information.

- « Previous Replies
-
- 1
- 2
- Next Replies »
Accepted Solutions
- Mark as New
- Bookmark
- Subscribe
- Mute
- Subscribe to RSS Feed
- Permalink
- Report Inappropriate Content
We are not looking for your actual data my friend.... we are looking for a representative data which is close to your actual data. I already provided one solution based on what you shared... I am going to provide another... but if that doesn't work... I am afraid I am not going to attempt again unless you provide a sample which is more inline with your actual data
Count(DISTINCT {<Year = {"$(='<=' & Max(Year))"}, Attribute = {'StartYear'}>}[EMP ID]) -
Count(DISTINCT {<Year = {"$(='<=' & Max(Year))"}, Attribute = {'Terminate Year'}>}[EMP ID])
- Mark as New
- Bookmark
- Subscribe
- Mute
- Subscribe to RSS Feed
- Permalink
- Report Inappropriate Content
How are you getting 5 for 2002? Total Started is 2 + 3 = 5 and 1 guy left.... Should it be 4? If it is 5, can you explain the logic?
- Mark as New
- Bookmark
- Subscribe
- Mute
- Subscribe to RSS Feed
- Permalink
- Report Inappropriate Content
Use Set Analysis,
Try the below expression,
Count({<Year={2002}>}Distinct Employee)
If u want to see all the separate year listed,
Count({<Year={$(=Max(Year))>}Distinct Employee)
- Mark as New
- Bookmark
- Subscribe
- Mute
- Subscribe to RSS Feed
- Permalink
- Report Inappropriate Content
Is this the exact representation of the dataset you are working with? I don't think so
Can you provide a sample
If a post helps to resolve your issue, please accept it as a Solution.
- Mark as New
- Bookmark
- Subscribe
- Mute
- Subscribe to RSS Feed
- Permalink
- Report Inappropriate Content
yes you correct sorry for that it should be 4
- Mark as New
- Bookmark
- Subscribe
- Mute
- Subscribe to RSS Feed
- Permalink
- Report Inappropriate Content
May be like this:
Sum({<Year = {"$(='<=' & Max(Year))"}>}[Employee Who Started]) -
Sum({<Year = {"$(='<=' & Max(Year))"}>}[Employee Who Terminated])
- Mark as New
- Bookmark
- Subscribe
- Mute
- Subscribe to RSS Feed
- Permalink
- Report Inappropriate Content
or this:
Sum({<Year = {"$(='<=' & Max(Year))"}>} RangeSum([Employee Who Started] - [Employee Who Terminated]))
- Mark as New
- Bookmark
- Subscribe
- Mute
- Subscribe to RSS Feed
- Permalink
- Report Inappropriate Content

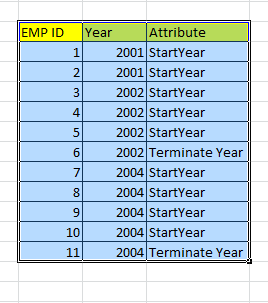
This is how dataset looks like.
- Mark as New
- Bookmark
- Subscribe
- Mute
- Subscribe to RSS Feed
- Permalink
- Report Inappropriate Content

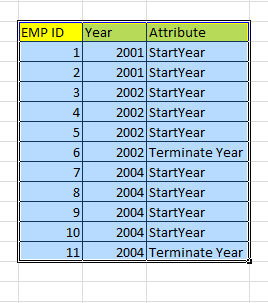
This is how dataset looks like.
- Mark as New
- Bookmark
- Subscribe
- Mute
- Subscribe to RSS Feed
- Permalink
- Report Inappropriate Content

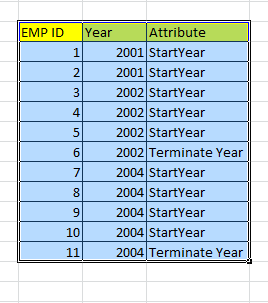
This is how dataset looks like.
- « Previous Replies
-
- 1
- 2
- Next Replies »