Unlock a world of possibilities! Login now and discover the exclusive benefits awaiting you.
- Qlik Community
- :
- Forums
- :
- Analytics
- :
- New to Qlik Analytics
- :
- Re: Color Coded Text Boxes: Values and Symbols in ...
- Subscribe to RSS Feed
- Mark Topic as New
- Mark Topic as Read
- Float this Topic for Current User
- Bookmark
- Subscribe
- Mute
- Printer Friendly Page
- Mark as New
- Bookmark
- Subscribe
- Mute
- Subscribe to RSS Feed
- Permalink
- Report Inappropriate Content
Color Coded Text Boxes: Values and Symbols in Qlik Sense
Hello,
I have created a few text boxes in QV Project that has color coded values and symbols coming up.
I would like to either replicate or need an alternate solution for the same to implement in Qlik Sense.
Kindly let me know which Extensions to be used or any work around to get the same view.
P.S. I tried using a few Tables and Text Boxes but no use.
PFB the attached screenshot for the issue.
Row 1
Text Box 1: Price
Text Box 2: 35M:
Expression: =vSalesPriceYTD&' '
Color Condition Formula:
If(vSalesPriceYTD%>=15,RGB(84,130,53),
if(vSalesPriceYTD%>=0 and vSalesPriceYTD%<=15, rgb(146,208,80),
if(vSalesPriceYTD%>=-15 and vSalesPriceYTD%<0, rgb(255,192,000),
if(vSalesPriceYTD%<-15,rgb(192,000,000)
))))
Text Box 4: ▲
Expression: =if(vSalesPriceYTD%>=0.0,'▲','▼')
Color Condition Formula is same.
I will be glad to receive guidance on it.
Thanks and Regards,
Pradnya.
- Mark as New
- Bookmark
- Subscribe
- Mute
- Subscribe to RSS Feed
- Permalink
- Report Inappropriate Content
This is what I tried achieving in Qlik Sense and quite unhappy with result. Kindly pour in your suggestions please.
1st is Horizontal Gauge.
2nd are text boxes with failed Color combination.
3rd is Pivot, giving result but I do not want Labels or Captions.
- Mark as New
- Bookmark
- Subscribe
- Mute
- Subscribe to RSS Feed
- Permalink
- Report Inappropriate Content
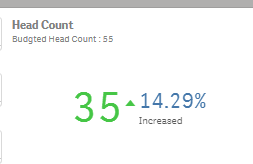
Try with #1 KPI,
It will show like below

- Mark as New
- Bookmark
- Subscribe
- Mute
- Subscribe to RSS Feed
- Permalink
- Report Inappropriate Content
I have 5 rows and 4 columns to show all of the values.
P.S. I have tried the above KPI
- Mark as New
- Bookmark
- Subscribe
- Mute
- Subscribe to RSS Feed
- Permalink
- Report Inappropriate Content
It is hard to replicate the same way as Qlik View in Qlik Sense, but if you show them one after another as tiles, then it will look good.
- Mark as New
- Bookmark
- Subscribe
- Mute
- Subscribe to RSS Feed
- Permalink
- Report Inappropriate Content
Don't forget !
When applicable please mark the appropriate replies as CORRECT https://community.qlik.com/docs/DOC-14806. This will help community members and Qlik Employees know which discussions have already been addressed and have a possible known solution. Please mark threads as HELPFUL if the provided solution is helpful to the problem, but does not necessarily solve the indicated problem. You can mark multiple threads as HELPFUL if you feel additional info is useful to others.