Unlock a world of possibilities! Login now and discover the exclusive benefits awaiting you.
- Qlik Community
- :
- All Forums
- :
- Visualization and Usability
- :
- Re: How to add custom category fields?
- Subscribe to RSS Feed
- Mark Topic as New
- Mark Topic as Read
- Float this Topic for Current User
- Bookmark
- Subscribe
- Mute
- Printer Friendly Page
- Mark as New
- Bookmark
- Subscribe
- Mute
- Subscribe to RSS Feed
- Permalink
- Report Inappropriate Content
How to add custom category fields?
Hello,
Suppose I have a dimension which is Country_Name and I want to create a new category which says All_Countries which is a grouping of all the country names so that I can show a single value for my measures. How do I do this using Qlik Sense?
Thanks,
Srijhari
- Mark as New
- Bookmark
- Subscribe
- Mute
- Subscribe to RSS Feed
- Permalink
- Report Inappropriate Content
Use Apply Map command.
Vikas
If the issue is solved please mark the answer with Accept as Solution & like it.
If you want to go quickly, go alone. If you want to go far, go together.
- Mark as New
- Bookmark
- Subscribe
- Mute
- Subscribe to RSS Feed
- Permalink
- Report Inappropriate Content
Could you please elaborate more on this?
Thanks for the help!
Srijhari
- Mark as New
- Bookmark
- Subscribe
- Mute
- Subscribe to RSS Feed
- Permalink
- Report Inappropriate Content
PFA sample.
Vikas
If the issue is solved please mark the answer with Accept as Solution & like it.
If you want to go quickly, go alone. If you want to go far, go together.
- Mark as New
- Bookmark
- Subscribe
- Mute
- Subscribe to RSS Feed
- Permalink
- Report Inappropriate Content
PFA sample.
Vikas
If the issue is solved please mark the answer with Accept as Solution & like it.
If you want to go quickly, go alone. If you want to go far, go together.
- Mark as New
- Bookmark
- Subscribe
- Mute
- Subscribe to RSS Feed
- Permalink
- Report Inappropriate Content
I am working on Qlik Sense. Could you attach a .qvf file or a snapshot of the code please?
Sorry for the trouble!
Thanks
- Mark as New
- Bookmark
- Subscribe
- Mute
- Subscribe to RSS Feed
- Permalink
- Report Inappropriate Content
Just search for Mapping in the Qlik Sense help!
Andy
- Mark as New
- Bookmark
- Subscribe
- Mute
- Subscribe to RSS Feed
- Permalink
- Report Inappropriate Content
Hi,
What are you trying to achieve? From the Filter Pane you can select all countries to select all. If you have a table the total row shows the value for all countries.
Are you trying to group countries by say a Region? I.e. Europe, North America, Australasia etc?
- Mark as New
- Bookmark
- Subscribe
- Mute
- Subscribe to RSS Feed
- Permalink
- Report Inappropriate Content
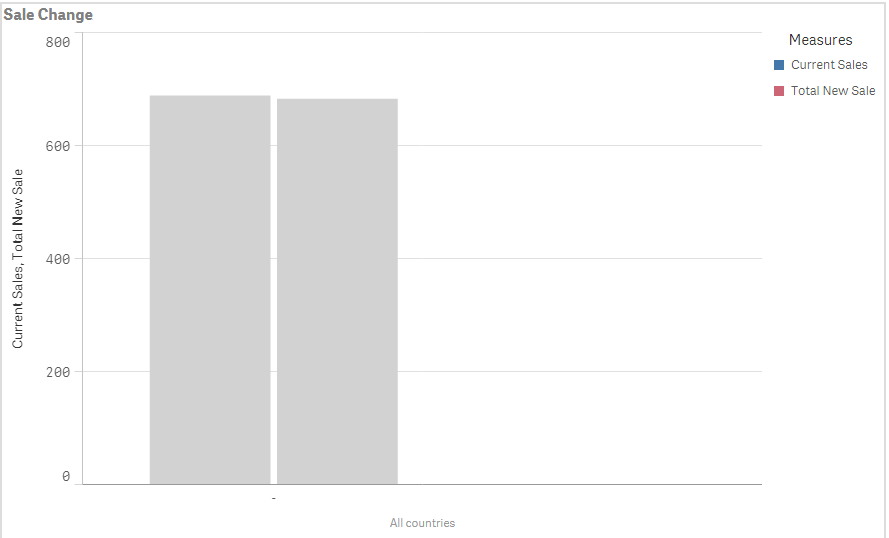
I am trying to use the field All_Countries in a bar chart, to show the Current Sale vs. Total New Sale. I've tried using the Apply Map function, but the chart shows null values. How do I resolve this?
Please find the attachment below.
This is the following piece of code that I used.
all_countries:
Load*,
ApplyMap('map', country_Name, 'Other') as 'All Countries'
resident map;
Thanks!
