Unlock a world of possibilities! Login now and discover the exclusive benefits awaiting you.
- Qlik Community
- :
- All Forums
- :
- Visualization and Usability
- :
- Re: Pivot table - add different measures into one ...
- Subscribe to RSS Feed
- Mark Topic as New
- Mark Topic as Read
- Float this Topic for Current User
- Bookmark
- Subscribe
- Mute
- Printer Friendly Page
- Mark as New
- Bookmark
- Subscribe
- Mute
- Subscribe to RSS Feed
- Permalink
- Report Inappropriate Content
Pivot table - add different measures into one Pivot table
Hi all,
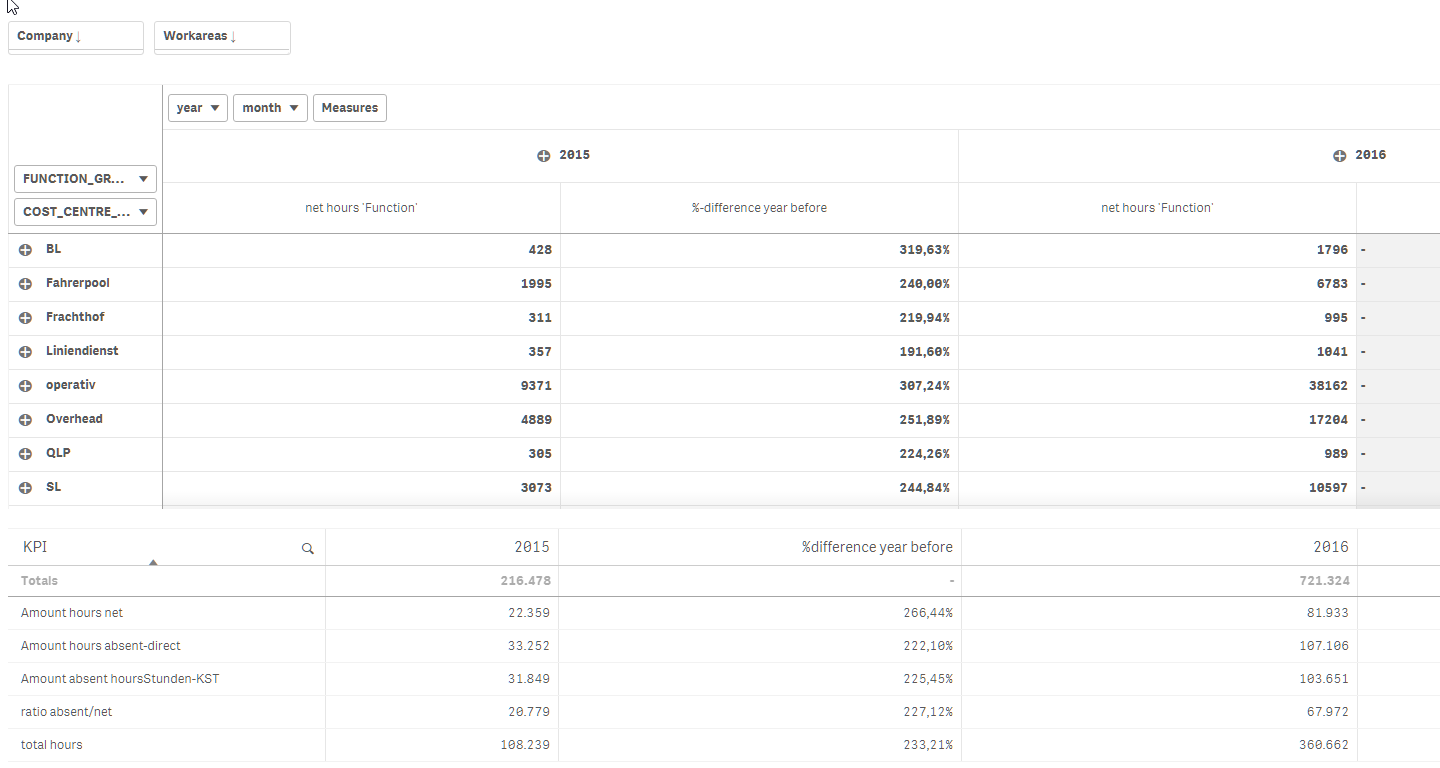
I am struggling to add different measures into one Pivot table. Right now my pivot table looks like this:
I have a pivot table which shows me the net hours each division has worked and the %-Difference to the year before.
Under the pivot table i have multiple KPIs. These show me the total amount of hours worked over all, absent hours. And the %-difference from 2016 to 2015 (comparing to the year before).
This doesn't look nice and I supposed to put this all into one table. My problem is if i add a new measure into the pivot table I get them as columns instead of a row below the actual pivot table.
Imagine that I want to enhance the pivot table multiple rows down and include the values that are below the pivot table into the pivot table.
I don't know if that is possible since there is text next to the KPIs. Is it possible to write text into the rows of a pivot table on the right of it the measure?
I thought about creating multiple pivot tables for each line of text and KPIs. But therefor I need to get rid of the headers. I know it's possible in QlikView but I read this function does not exist in QlikSense.
I think I have to make changes during the script. But I don't know what and how I should do that.
I have added a datasample.
Thank you for your help ![]()
- « Previous Replies
-
- 1
- 2
- Next Replies »
- Mark as New
- Bookmark
- Subscribe
- Mute
- Subscribe to RSS Feed
- Permalink
- Report Inappropriate Content
Something like this you had in mind?

- Mark as New
- Bookmark
- Subscribe
- Mute
- Subscribe to RSS Feed
- Permalink
- Report Inappropriate Content
Hi Petter,
it comes quite close. The issue why it all should be in one Pivot table is, so that the user is able to break everything down into months. If you look at the top of the Pivot table you see the years 2015 and 2016 with the + next to it. If you press it the pivot table breaks down into months and all the values for each month are shown. So first the user sees the years but when he presses on the + then he sees all the months and their specific values to the Function_Groups.
That's the main reason why it should all into one Pivot table.
Is something like this possible?
But first let me thank you. In my opinion your solution looks already better what I had ![]()
- Mark as New
- Bookmark
- Subscribe
- Mute
- Subscribe to RSS Feed
- Permalink
- Report Inappropriate Content
Well now that I understand you a bit more clearly ...
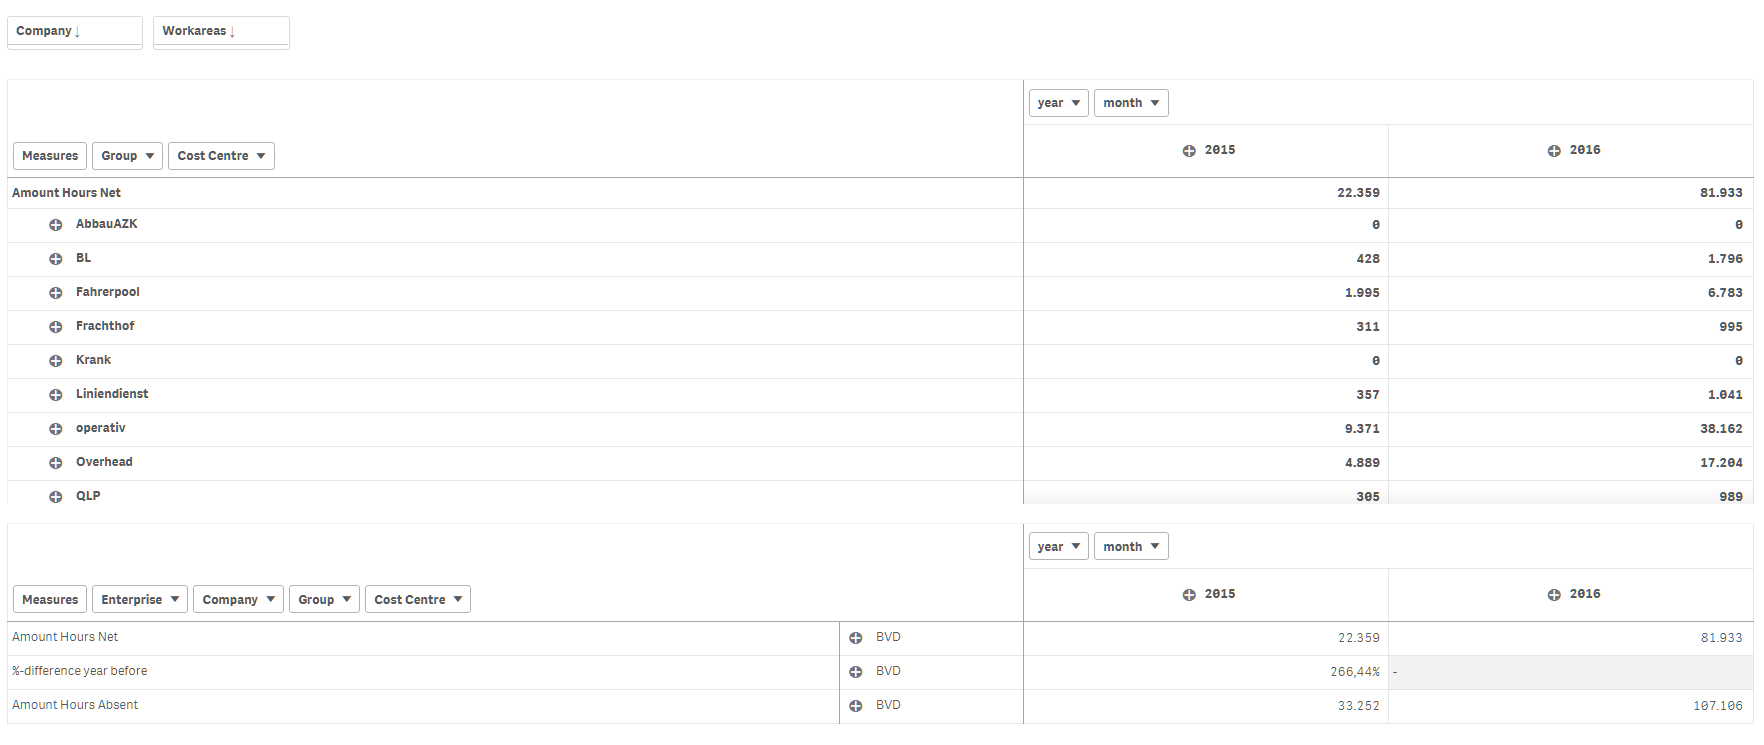
Actually it is quite easy to just add the measures into you pivot and along with the measures you have to add the necessary dimensions for grouping an summation and it will look like this:

You can just add additional measures just like I have made the [Amount Hours Net] and [Amount Hours Absent]...
- Mark as New
- Bookmark
- Subscribe
- Mute
- Subscribe to RSS Feed
- Permalink
- Report Inappropriate Content
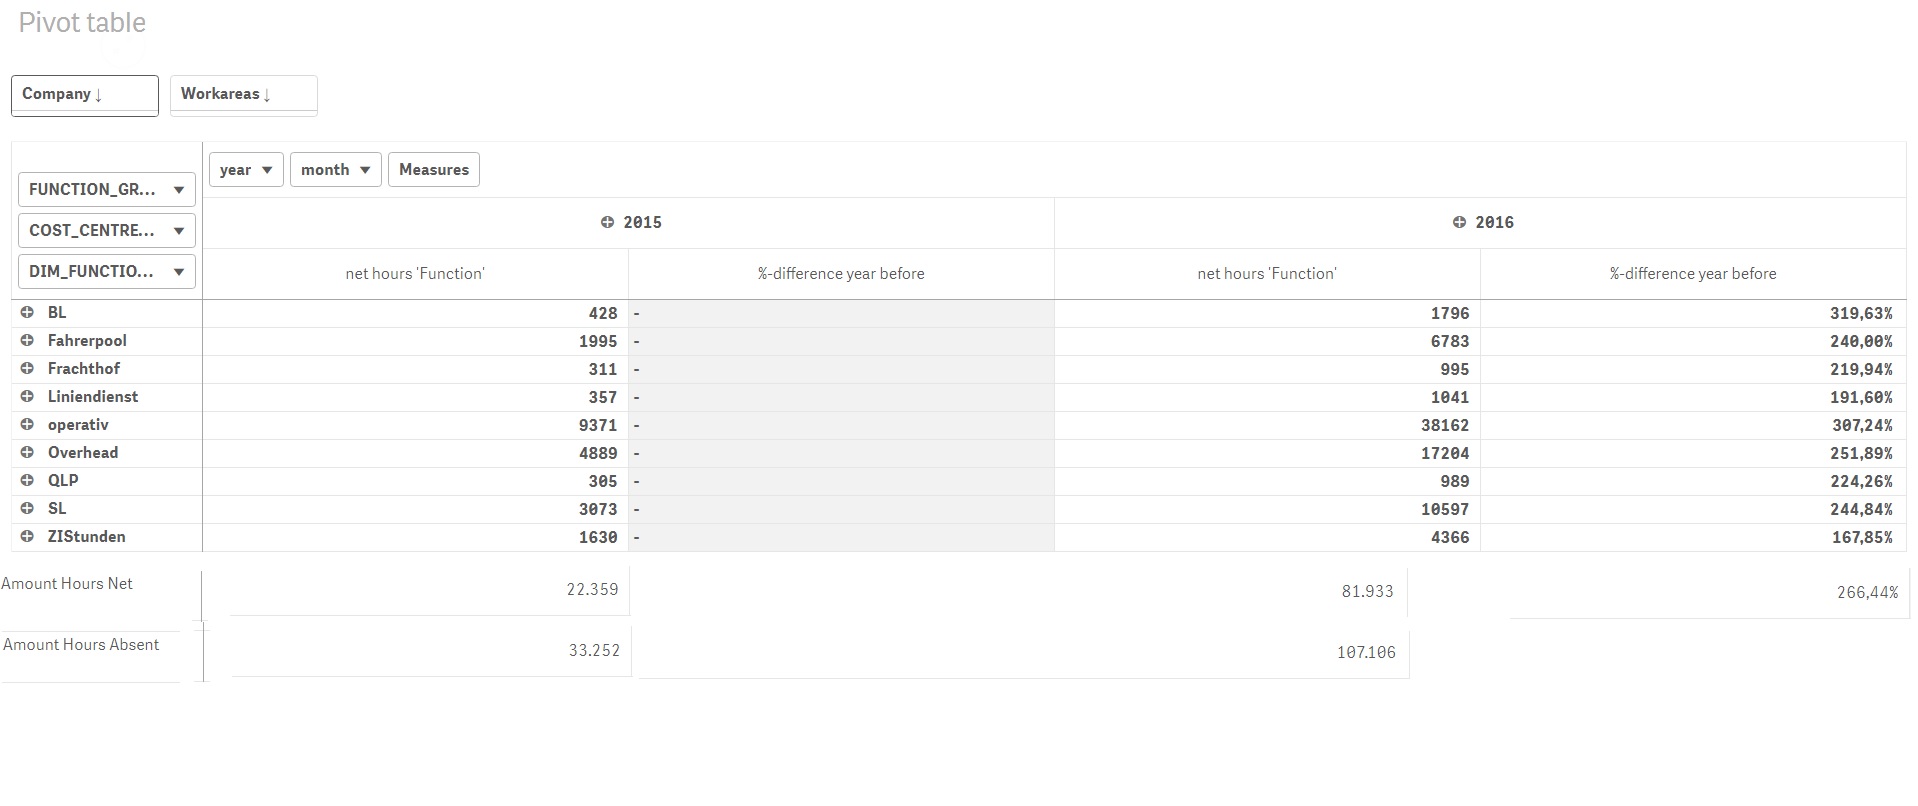
There is just the issue with how the pivot table looks like when I ass the measures.
It should look like this
 It's quite close to the solution you posted. Is something like this possible?
- Mark as New
- Bookmark
- Subscribe
- Mute
- Subscribe to RSS Feed
- Permalink
- Report Inappropriate Content
Creating two tables that are rather similar is an option that is straight-forward:

If you want to have them in a single pivot table that would be more time consuming to achieve and possibly a "hack" to achieve - nevertheless possible...
- Mark as New
- Bookmark
- Subscribe
- Mute
- Subscribe to RSS Feed
- Permalink
- Report Inappropriate Content
Hmm I also thought about building two tables. But the problem is the header of the second table.
I should built them all into one.... that's also my problem.
What sort of "hack" does it need? I can also wait if you might have some time later on.
I really don't know how to do this since all I had was the first introduction training into QlikSense....
Can't thank you enough Petter ![]()
- Mark as New
- Bookmark
- Subscribe
- Mute
- Subscribe to RSS Feed
- Permalink
- Report Inappropriate Content
Roughly it would be like this:
The "hack" consists of extending the data model with addtional values for the GROSS_NET which contains the titles/labels for the summary rows. Except for FUNC_ID that needs to be populated some or all of the other fields could be set to NULL (no value). Futhermore for the FUNC_ID value that represents the summary rows additional rows with DATA_ID-FACT_HOUR set to NULL would be populated for all the range of dates that is present in DIM_DATE - that is that the Date_Dimension key is populated correctly...
Since I don't have the option of modifying the data model it is hard for me to test.
- Mark as New
- Bookmark
- Subscribe
- Mute
- Subscribe to RSS Feed
- Permalink
- Report Inappropriate Content
Is there a possibility how you can modify the data model?
Right I am using right now is a localhost oracle database for just a sample set of data.
I loaded it into qlik sense and exported the app.
I guess the hack would be with scripting? Isn't that possible with the exported app?
Or do you mean after scripting you need to reload the data from the database to see if everything is working?
It's quite hard for me to understand what you mean with the "hack" since I'm very new to QlikSense.
- Mark as New
- Bookmark
- Subscribe
- Mute
- Subscribe to RSS Feed
- Permalink
- Report Inappropriate Content
With hack I mean something that involves using techniques that are not obvious or straightforward.
And yes it involves doing a little bit extra in the data model. That part is not complicated or extensive. It is only piecing it together that might seem a little bit confusing if you are new to Qlik Sense.
If you can provide me with all the test data as tables in an Excel spreadsheet or in a collection of CSV-files we could give it a go with the last approach... ?
- « Previous Replies
-
- 1
- 2
- Next Replies »