Unlock a world of possibilities! Login now and discover the exclusive benefits awaiting you.
- Qlik Community
- :
- All Forums
- :
- Visualization and Usability
- :
- Visualizing the data as in Excel
- Subscribe to RSS Feed
- Mark Topic as New
- Mark Topic as Read
- Float this Topic for Current User
- Bookmark
- Subscribe
- Mute
- Printer Friendly Page
- Mark as New
- Bookmark
- Subscribe
- Mute
- Subscribe to RSS Feed
- Permalink
- Report Inappropriate Content
Visualizing the data as in Excel
Hi,
Is it possible to visualize the data in Pivot/Table in Qlik Sense like we are able to do in Excel in a table format with multiple columns without nesting?
| ID | Age | Gender | Weight | Height |
|---|---|---|---|---|
When i tried Pivot table in Qlik Sense, it nested the column variables one below the other. Is there a way to work around that?
Thanks
- Mark as New
- Bookmark
- Subscribe
- Mute
- Subscribe to RSS Feed
- Permalink
- Report Inappropriate Content
Hi Malvika,
Could you share an example of your pivot, that you doesn't like?
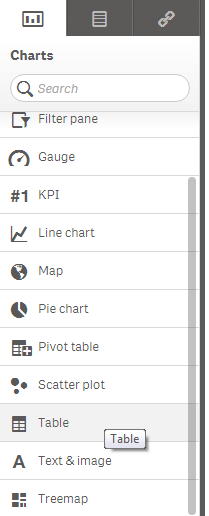
On the picture I can only see a straight table, that you can make easily in Qlik Sense, just drop the table object onto the sheet.
You can make a table with drill-down dimension to avoid a Pivot.
Example: Drill-down dimension = Gender -> Age ->ID
The height and weight will be the measures.
Before drill-down:
Gender avg(height) avg(weight)
M 178 80
F 177 55
After drill-down (M selected):
Age avg(height) avg(weight)
21-25 179 81
26-30 177 79
31-35 178 80
G.
- Mark as New
- Bookmark
- Subscribe
- Mute
- Subscribe to RSS Feed
- Permalink
- Report Inappropriate Content
If what you want is the table not to collapse the fields you need to select fully expanded in the settings
if you select
you will get
rather than
- Mark as New
- Bookmark
- Subscribe
- Mute
- Subscribe to RSS Feed
- Permalink
- Report Inappropriate Content
Hi,
Instead of Pivot table you can use normal table object for this.
Regards,
jagan.
- Mark as New
- Bookmark
- Subscribe
- Mute
- Subscribe to RSS Feed
- Permalink
- Report Inappropriate Content
Instead of Pivot try Simple table, where
Dim: ID, Age, Gender
Expression: Wright , Height
I think it should work!!
- Mark as New
- Bookmark
- Subscribe
- Mute
- Subscribe to RSS Feed
- Permalink
- Report Inappropriate Content
Thanks Bella, but this would nest one column below the other, what i am looking for is separate columns for each variable and not nesting (as shown below) . Any way around that?
- Mark as New
- Bookmark
- Subscribe
- Mute
- Subscribe to RSS Feed
- Permalink
- Report Inappropriate Content
Hi Malvika,
You will have to go with a straight table to achieve this.
Thanks,
Sangram.
- Mark as New
- Bookmark
- Subscribe
- Mute
- Subscribe to RSS Feed
- Permalink
- Report Inappropriate Content
Hi Malvika,
You can useTable Object and you put dimension and measurement there.

Regards,
Marco