Unlock a world of possibilities! Login now and discover the exclusive benefits awaiting you.
- Qlik Community
- :
- Forums
- :
- Analytics
- :
- Topics
- :
- Visualization and Usability
- :
- Re: X-axis doesn't show all values (date axis)
- Subscribe to RSS Feed
- Mark Topic as New
- Mark Topic as Read
- Float this Topic for Current User
- Bookmark
- Subscribe
- Mute
- Printer Friendly Page
- Mark as New
- Bookmark
- Subscribe
- Mute
- Subscribe to RSS Feed
- Permalink
- Report Inappropriate Content
X-axis doesn't show all values (date axis)
Hi everyone,
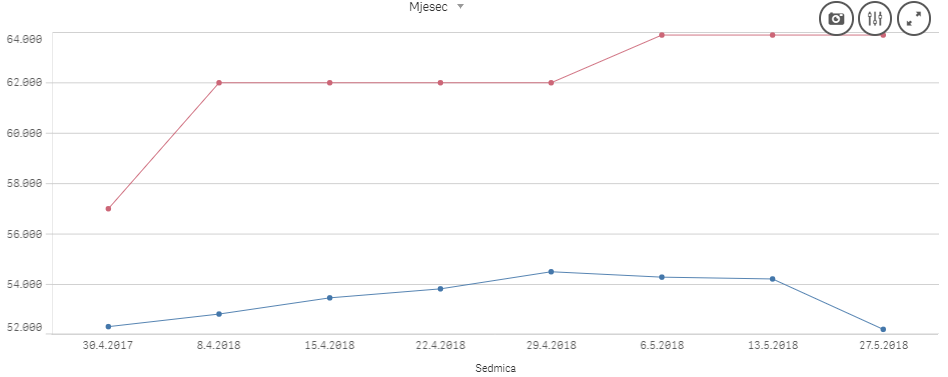
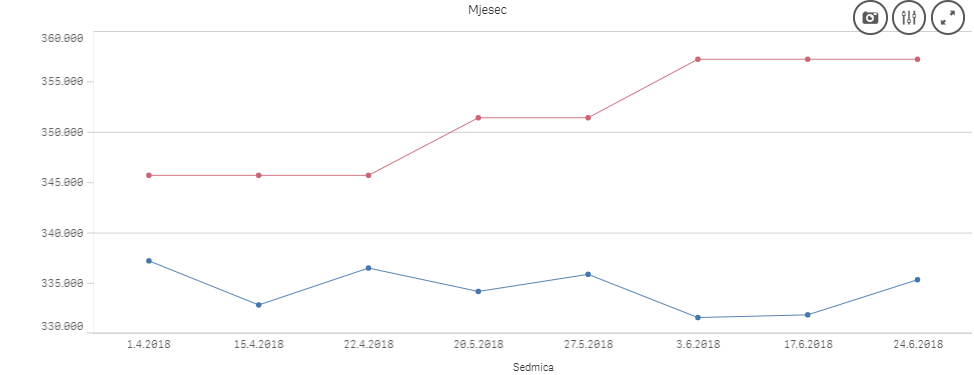
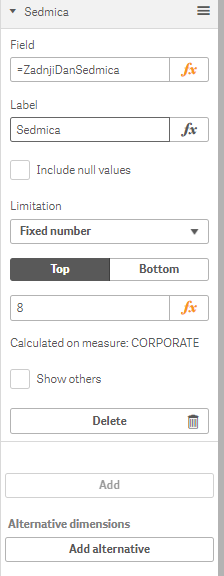
I need to show data values, for last 8 weeks, or 12 last months. I make in properties "fixed number" and 8 and top. But Qlik Sense doesn't give me what I need
I need it shows to me x-axis with values (end of weeks):
6.5., 13.5., 20.5., 27.5.,3.6, 10.6., 17.6., 24. 6.
It is missing some values.


I cannot understand what is problem, like it puts randomly values.

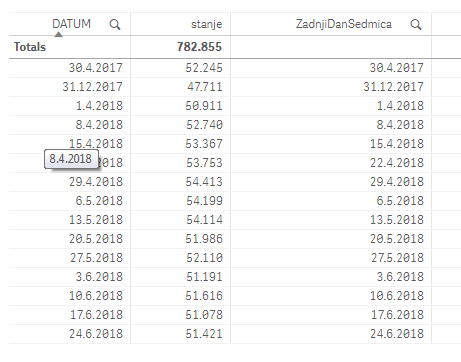
ZadnjiDanSedmica is defined in Data load editor: if (date(DATUM) = Floor(weekEnd(DATUM)),DATUM) as ZadnjiDanSedmica
DATUM is date.
Thanks
- Mark as New
- Bookmark
- Subscribe
- Mute
- Subscribe to RSS Feed
- Permalink
- Report Inappropriate Content
Hi, this happens when you don't have data on all dates. Qlik will summarize over all versions of the dimension (date) that is in the data set.
If you have a complete calendar a good practice is to add an additional expression that shows all dimension values, for example:
Only({1<Year = {$(=Max(Year))}>}Week) will show all weeks in the current selected year (or highest year if no year is selected).
This is how I normally sort out situations like this.
- Mark as New
- Bookmark
- Subscribe
- Mute
- Subscribe to RSS Feed
- Permalink
- Report Inappropriate Content
Can you show me this on example?
Thanks
- Mark as New
- Bookmark
- Subscribe
- Mute
- Subscribe to RSS Feed
- Permalink
- Report Inappropriate Content
I have values for all dates 
- Mark as New
- Bookmark
- Subscribe
- Mute
- Subscribe to RSS Feed
- Permalink
- Report Inappropriate Content
hi
I guess the top 10 is getting applied on values ,based on the values you are trying to pull the date, so you might be missing some dates, Just try to play with it, You should get it .
Anand
- Mark as New
- Bookmark
- Subscribe
- Mute
- Subscribe to RSS Feed
- Permalink
- Report Inappropriate Content
With Qlik is always palying. ![]()
- Mark as New
- Bookmark
- Subscribe
- Mute
- Subscribe to RSS Feed
- Permalink
- Report Inappropriate Content
Hello, Can you please post the solution?