Unlock a world of possibilities! Login now and discover the exclusive benefits awaiting you.
- Qlik Community
- :
- Forums
- :
- Analytics
- :
- New to Qlik Analytics
- :
- Year over year comparison
- Subscribe to RSS Feed
- Mark Topic as New
- Mark Topic as Read
- Float this Topic for Current User
- Bookmark
- Subscribe
- Mute
- Printer Friendly Page
- Mark as New
- Bookmark
- Subscribe
- Mute
- Subscribe to RSS Feed
- Permalink
- Report Inappropriate Content
Year over year comparison
Hi,
I would like create a chart that shows sales dynamic year over year within year dimension or month dimension.
It's quite common as I expect, but I've searched through the resources i.e. Set Analysis for certain Point in Time
and I've tried to implement it to my model but I didn't manage.
This is the formula I've created to build year over year within year dimension
Sum({<Category={"Sales"}>} Amount)/
Sum({<Category={"Sales"},Year=${"Year-1"}>} Amount)
I've tried many combinations, but I didn't find the proper solution.
What is more if I want to have the formula working correctly within month dimension which means I would like to have my values ie. dived by 2016 - May over 2015 - May, this is something I'm unable to overcome currently.
- Tags:
- year over year
- « Previous Replies
-
- 1
- 2
- Next Replies »
Accepted Solutions
- Mark as New
- Bookmark
- Subscribe
- Mute
- Subscribe to RSS Feed
- Permalink
- Report Inappropriate Content
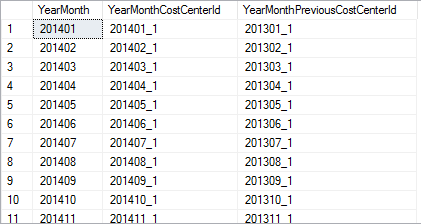
Because I couldn't get the effect with set analysis I've created an additional View using SQL.
I have moved bacward the period in the table where is the structure of the company and that is hov I get the desired effect. It's not ideal but it works fine for me.
Maciek

- Mark as New
- Bookmark
- Subscribe
- Mute
- Subscribe to RSS Feed
- Permalink
- Report Inappropriate Content
Hi
if you have Month data like MMM-YYYY (May-2016) as MonthYear , you can try this
Current month (last year)
Sum({$<[MonthYear]={"$(=Date(AddYears(Max(MonthYear), -1), 'MMM-YYYY'))"}>}Amount )
Current month (this year)
Sum({$<[MonthYear]={"$(=Date(Max(MonthYear), 'MMM-YYYY'))"}>} Amount )
so for your situation :
try this ..
Sum({$<[MonthYear]={"$(=Date(Max(MonthYear), 'MMM-YYYY'))"}>} Amount ) /
Sum({$<[MonthYear]={"$(=Date(AddYears(Max(MonthYear), -1), 'MMM-YYYY'))"}>}Amount )
- Mark as New
- Bookmark
- Subscribe
- Mute
- Subscribe to RSS Feed
- Permalink
- Report Inappropriate Content
Thanks, I've added this date format to my MasterCalendar
like that Month(TempDate)&'-'&Year(TempDate) AS MonthYear
and then I've added this formula - exactly as Yours but with additional Category filter but it didn't work.
Sum({$<[MonthYear]={"$(=Date(Max(MonthYear), 'MMM-YYYY'))"},Category={"Sales"}>} Amount) /
Sum({$<[MonthYear]={"$(=Date(AddYears(Max(MonthYear), -1), 'MMM-YYYY'))"},Category={"Sales"}>}Amount)
- Mark as New
- Bookmark
- Subscribe
- Mute
- Subscribe to RSS Feed
- Permalink
- Report Inappropriate Content
Hi
1)Is your Monthyear filed in MMM-YYYY format ?
2)what output is coming when apply only one year like following ..?
Sum({$<[MonthYear]={"$(=Date(Max(MonthYear), 'MMM-YYYY'))"},Category={"Sales"}>} Amount)
- Mark as New
- Bookmark
- Subscribe
- Mute
- Subscribe to RSS Feed
- Permalink
- Report Inappropriate Content
1) Yes
2) It gives 0 as a result.
- Mark as New
- Bookmark
- Subscribe
- Mute
- Subscribe to RSS Feed
- Permalink
- Report Inappropriate Content
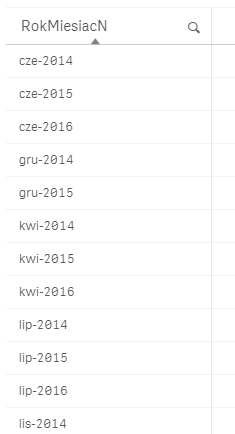
This is the effect of MMM-YYYY joining in MasterCalendar. When I sort it, it is sorted like it was a text, because "cze" in Polish means "jun" in English. (below)
Although I've used in another chart that kind of variable.
Sum({$<Year={"$(=year(addyears(max(DocumentDate),-1)))"},Category={"Sales"}>}Amount)
It gives as a result Sales for the previous year correctly, but when I try to use it
something like that, it gives me for some variants good results, but when I analyse data with yearly dimension it is not good.
Sum({$<Category={"Sales"}>}Amount)/
Sum({$<Year={"$(=year(addyears(max(DocumentDate),-1)))"},Category={"Sales"}>}Amount)

- Mark as New
- Bookmark
- Subscribe
- Mute
- Subscribe to RSS Feed
- Permalink
- Report Inappropriate Content
Create a MonthYear field like below
DATE(MonthStart(DocumentDate,'MMM-YYYY')) as MonthYear
Expression for Previous Year Same Month
Sum({$<[MonthYear]={"$(= Date(AddYears( Date(max(DocumentDate)),-1),'YYYYMM') )"},Category={"Sales"}>}Amount)
If a post helps to resolve your issue, please accept it as a Solution.
- Mark as New
- Bookmark
- Subscribe
- Mute
- Subscribe to RSS Feed
- Permalink
- Report Inappropriate Content
If I want to generate the date like You suggested
DATE(MonthStart(DocumentDate,'MMM-YYYY')) as MonthYear
I have to change "DocumentDate" into "TempDate" from my Master Calendar. But it doesn't show any results - this dimension is without any data.
However in Your second formula MonthYear is compared with the format YYYYMM which is not the format for MonthYear = MMM-YYYY.
If I compare it with the dimension I've created with the format YYYYMM it still doesn't work properly.
It works fine for months when I use that kind of formula like below. However it's not good when I want to analyze data over Year dimension which is the problem for now.
Sum({$<Category={"Sales"}>}Amount)/
Sum({$<Year={"$(=year(addyears(max(DocumentDate),-1)))"},Month-={">$(=$(varMonthMax))"},Category={"Sales"}
>}Amount)
where
varMonthMax=Num(Month(max(DocumentDate)))
- Mark as New
- Bookmark
- Subscribe
- Mute
- Subscribe to RSS Feed
- Permalink
- Report Inappropriate Content
Still no idea, I can handle with the issue comparing year over year when in dimension on X - axis is month. However it doesn't work when I need to have Year there. Suggestions above didn't work for me or I implemented them wrong.
I would like to have values in my chart that could show my Year over Year Sales dynamics.
- Mark as New
- Bookmark
- Subscribe
- Mute
- Subscribe to RSS Feed
- Permalink
- Report Inappropriate Content
Can you please share ur app, or app with sample data and where the logic is not working?
- « Previous Replies
-
- 1
- 2
- Next Replies »