Unlock a world of possibilities! Login now and discover the exclusive benefits awaiting you.
- Qlik Community
- :
- Forums
- :
- Analytics
- :
- New to Qlik Analytics
- :
- Year over year comparison
- Subscribe to RSS Feed
- Mark Topic as New
- Mark Topic as Read
- Float this Topic for Current User
- Bookmark
- Subscribe
- Mute
- Printer Friendly Page
- Mark as New
- Bookmark
- Subscribe
- Mute
- Subscribe to RSS Feed
- Permalink
- Report Inappropriate Content
Year over year comparison
Hi,
I would like create a chart that shows sales dynamic year over year within year dimension or month dimension.
It's quite common as I expect, but I've searched through the resources i.e. Set Analysis for certain Point in Time
and I've tried to implement it to my model but I didn't manage.
This is the formula I've created to build year over year within year dimension
Sum({<Category={"Sales"}>} Amount)/
Sum({<Category={"Sales"},Year=${"Year-1"}>} Amount)
I've tried many combinations, but I didn't find the proper solution.
What is more if I want to have the formula working correctly within month dimension which means I would like to have my values ie. dived by 2016 - May over 2015 - May, this is something I'm unable to overcome currently.
- Tags:
- year over year
- « Previous Replies
-
- 1
- 2
- Next Replies »
- Mark as New
- Bookmark
- Subscribe
- Mute
- Subscribe to RSS Feed
- Permalink
- Report Inappropriate Content
Hi,
Thank you for your reply. This is my sample app. There is no problem for YoY comparison over months, by over Year dimension it doesn;t work.
Maciek
- Mark as New
- Bookmark
- Subscribe
- Mute
- Subscribe to RSS Feed
- Permalink
- Report Inappropriate Content
Hi, For year on year, You want to compare the current yr/last yr numbers rite?. i have added the logic for u in the app. Please check and let me know.
- Mark as New
- Bookmark
- Subscribe
- Mute
- Subscribe to RSS Feed
- Permalink
- Report Inappropriate Content
Hi,
Yes, I would like to compare the year with the previous year. But I would like to have it compared in one bar chart and in percent.
Your app works fine if I analyze year over year but with months
If I divide it, it is the format required (one series):
Sum({$<Category={"Sales"},Year={"$(=max(Year))"}>}Amount)
/
Sum({$<Category={"Sales"},Year={"$(=max(Year)-1)"}>}Amount).
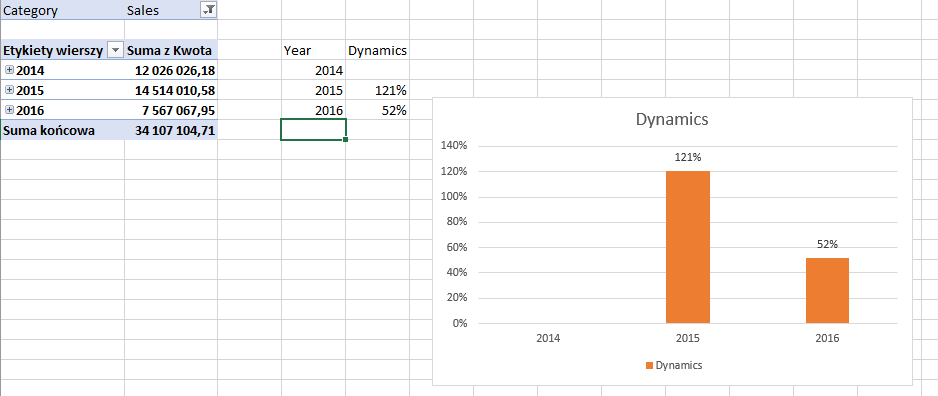
However I would like to get more complex result as well: for year:
So on my X axis If I have:
Year 2016 I would like to have value on Y axis "Sales 2016/Sales 2015"
Year 2015 I would like to have value on Y axis "Sales 2015/Sales 2014"
Year 2014 I would like to have value on Y axis "Sales 2014/Sales 2013" (in the database there is no data for 2013 so it would result in 0)
Year 2013 I would like to have value on Y axis "Sales 2013/Sales 2012" (in the database there is no data for 2012 so it would result in 0)
Just like on the screen below.
Is it feasible?

- Mark as New
- Bookmark
- Subscribe
- Mute
- Subscribe to RSS Feed
- Permalink
- Report Inappropriate Content
Hi, I'm afraid it is not possible as set analysis is done considering the dimensions. There is not direct way to do the above requirement.
- Mark as New
- Bookmark
- Subscribe
- Mute
- Subscribe to RSS Feed
- Permalink
- Report Inappropriate Content
Hi,
Thats a pity, ok. Thank you for your time and your help.
Maciek
- Mark as New
- Bookmark
- Subscribe
- Mute
- Subscribe to RSS Feed
- Permalink
- Report Inappropriate Content
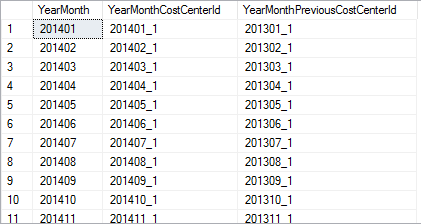
Because I couldn't get the effect with set analysis I've created an additional View using SQL.
I have moved bacward the period in the table where is the structure of the company and that is hov I get the desired effect. It's not ideal but it works fine for me.
Maciek

- Mark as New
- Bookmark
- Subscribe
- Mute
- Subscribe to RSS Feed
- Permalink
- Report Inappropriate Content
Hi Maciej
Is this the only way to achieve result? I think some combination of variables and TOTAL tag in expression is the right way.
Przemysław Staniszewski
- Mark as New
- Bookmark
- Subscribe
- Mute
- Subscribe to RSS Feed
- Permalink
- Report Inappropriate Content
Hi Przemek,
I believe it's not the only way to do this. However, I have put a lot of effort to achieve it and I've failed to get satisfactory results. In my opinion using TOTAL is not the direction I would search for the solution of the problem. As I understand TOTAL, it would bring the total sum of the measure, while I would like to compare values from the specific period to the values from the relevant period but a year before (i.e. a year or a month).
I think maybe the clue is in attached document somewhere in the point "4.6.1 Numeric function".
Maciek
- Mark as New
- Bookmark
- Subscribe
- Mute
- Subscribe to RSS Feed
- Permalink
- Report Inappropriate Content
Hi
Can you please attach sample QVF i have same requirement
Vikas
If the issue is solved please mark the answer with Accept as Solution & like it.
If you want to go quickly, go alone. If you want to go far, go together.
- Mark as New
- Bookmark
- Subscribe
- Mute
- Subscribe to RSS Feed
- Permalink
- Report Inappropriate Content
Hello , I am meeting the same problem right now , could you please share the expression as well ?
- « Previous Replies
-
- 1
- 2
- Next Replies »