- Mark as New
- Bookmark
- Subscribe
- Mute
- Subscribe to RSS Feed
- Permalink
- Report Inappropriate Content
cumulative sum in bar chart
Hello everyone,
I am trying to calculate cumulative sum in a bar chart in Qlik Sense which has two dimensions; month and year. My measure is sum of Sales.
What I want is, sales values should be cumulatively summed in bar chart for the selected months.
For example: March 2016 sales values should be sum of Jan 2016 and Feb 2016 on pivot table and rest of them also should be the same.
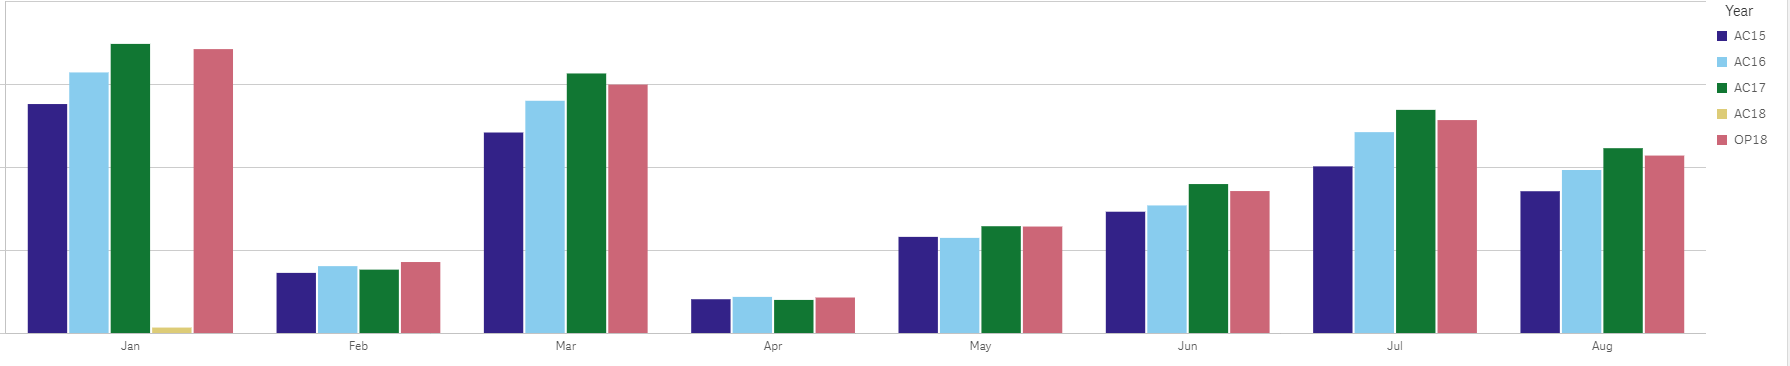
Right now I have below bar chart, it is only showing the related month year sales data.
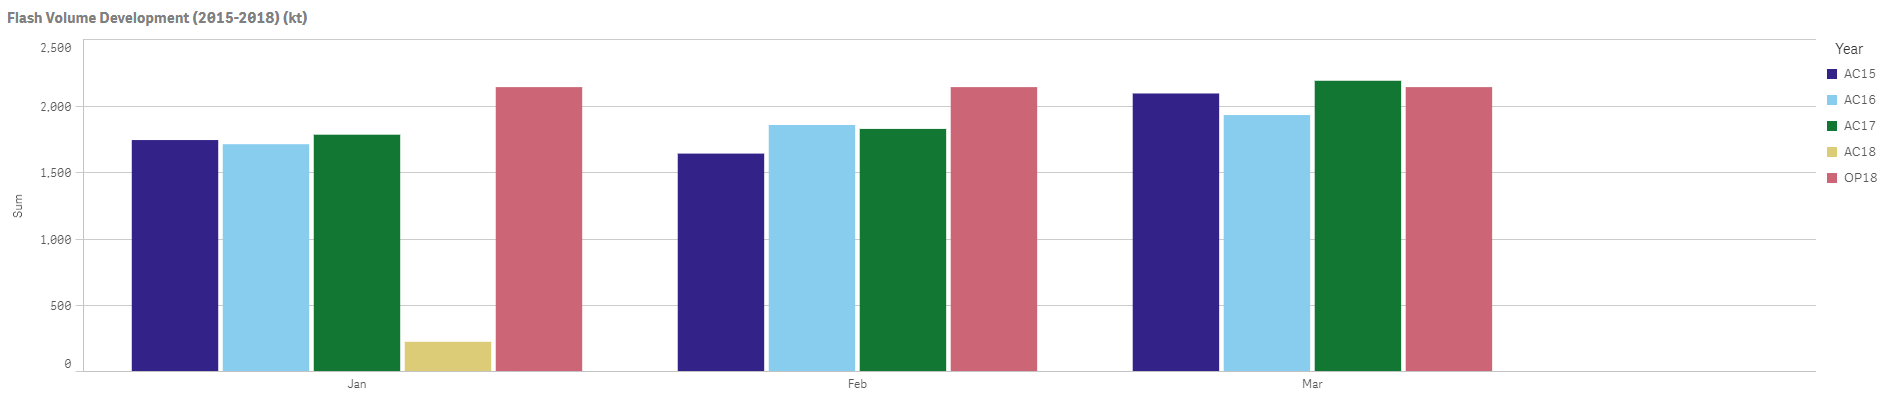
I have tried "=RangeSum(Above(Sum(Sales), 0, RowNo(total)))" but it has not worked. Result of the "=RangeSum(Above(Sum(Sales), 0, RowNo(total)))" is below picture.
.PNG)
Please suggest me any solution if anyone of you gone through the same problem.
Thanks.
OY
- « Previous Replies
- Next Replies »
Accepted Solutions
- Mark as New
- Bookmark
- Subscribe
- Mute
- Subscribe to RSS Feed
- Permalink
- Report Inappropriate Content
Give this a shot
Aggr(RangeSum(Above(Sum(Sales), 0, RowNo())),Year, (Month, (NUMERIC)))
- Mark as New
- Bookmark
- Subscribe
- Mute
- Subscribe to RSS Feed
- Permalink
- Report Inappropriate Content
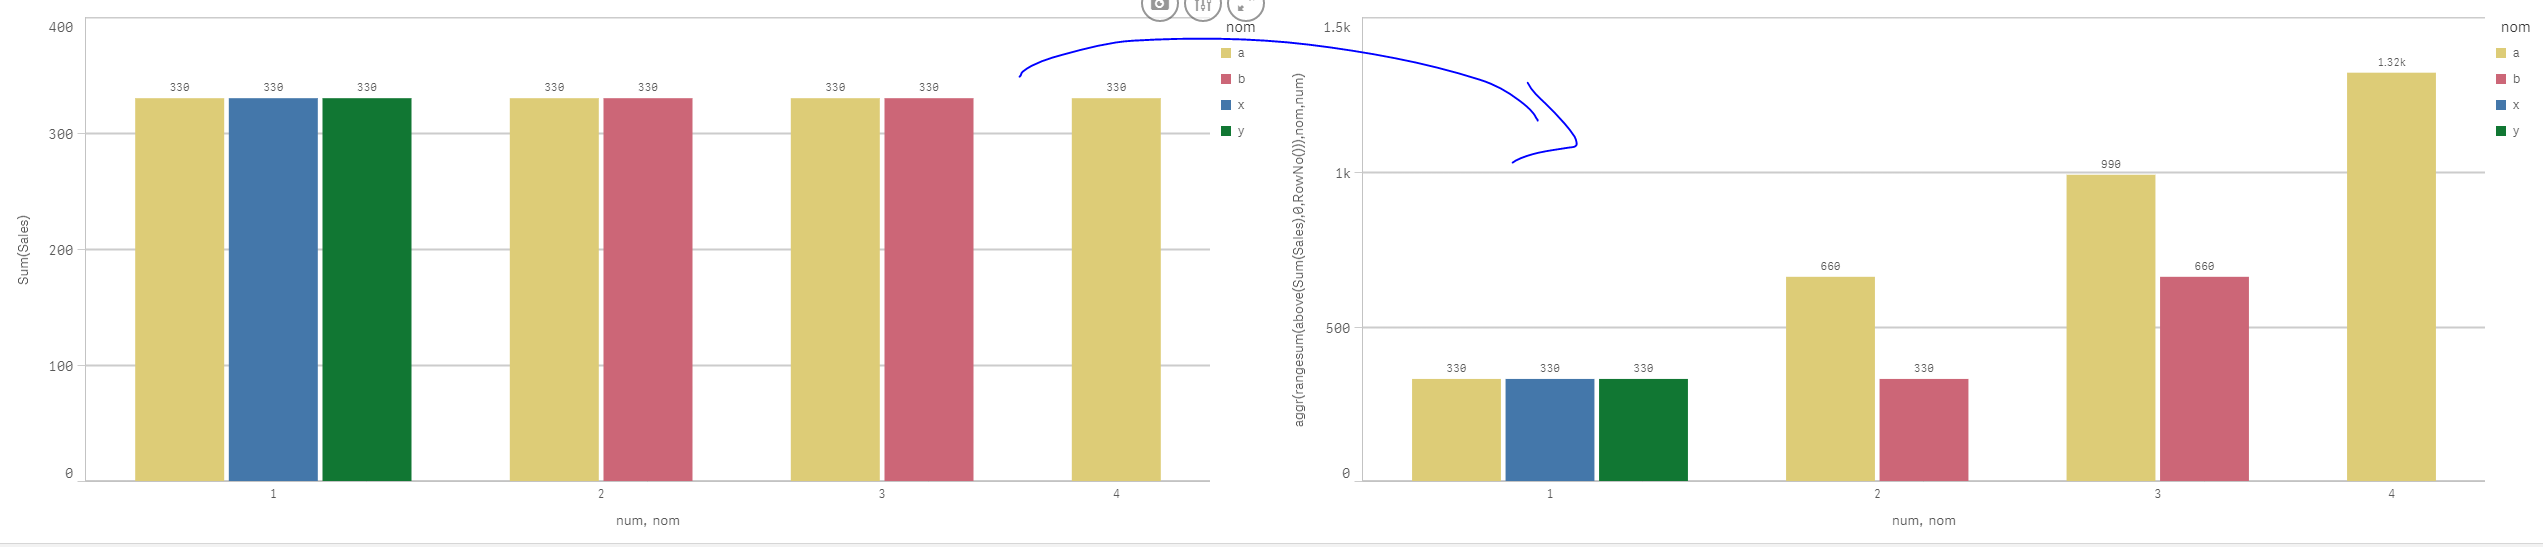
try:
aggr(rangesum(above(Sum(Sales),0,RowNo())),SecondDim,FirstDim)
Result (per analogy):
aggr(rangesum(above(Sum(Sales),0,RowNo())),nom,num)
- Mark as New
- Bookmark
- Subscribe
- Mute
- Subscribe to RSS Feed
- Permalink
- Report Inappropriate Content
Hello Omar,
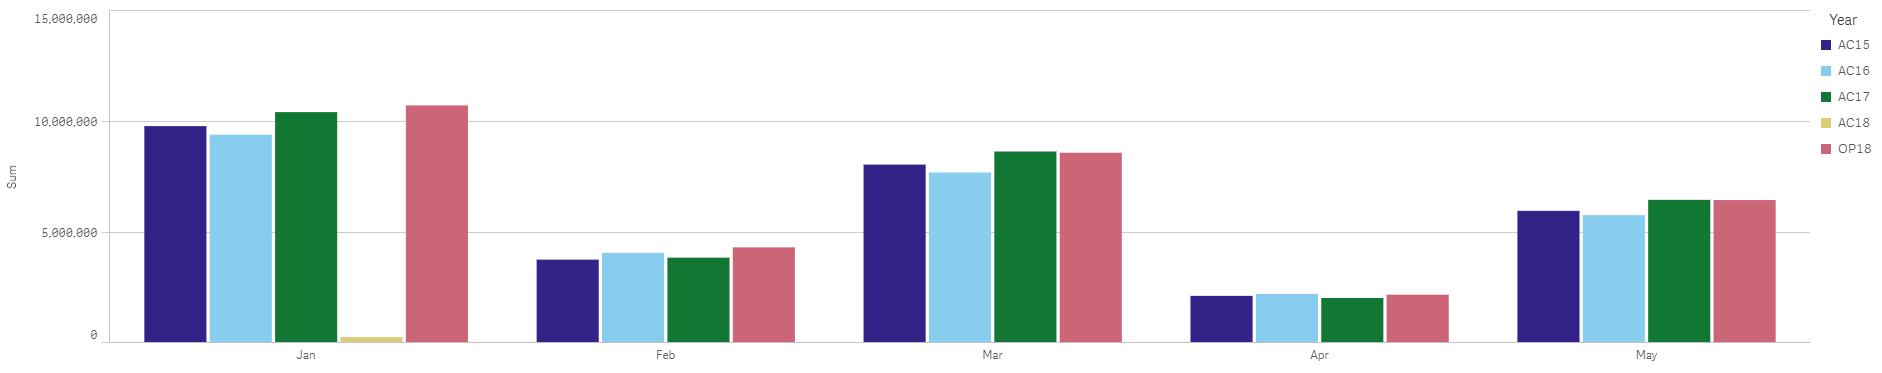
provided script not working, result of the script is first picure, however month figures should increase incremant like second picture. related month figures should be cumulatively summed.
- Mark as New
- Bookmark
- Subscribe
- Mute
- Subscribe to RSS Feed
- Permalink
- Report Inappropriate Content
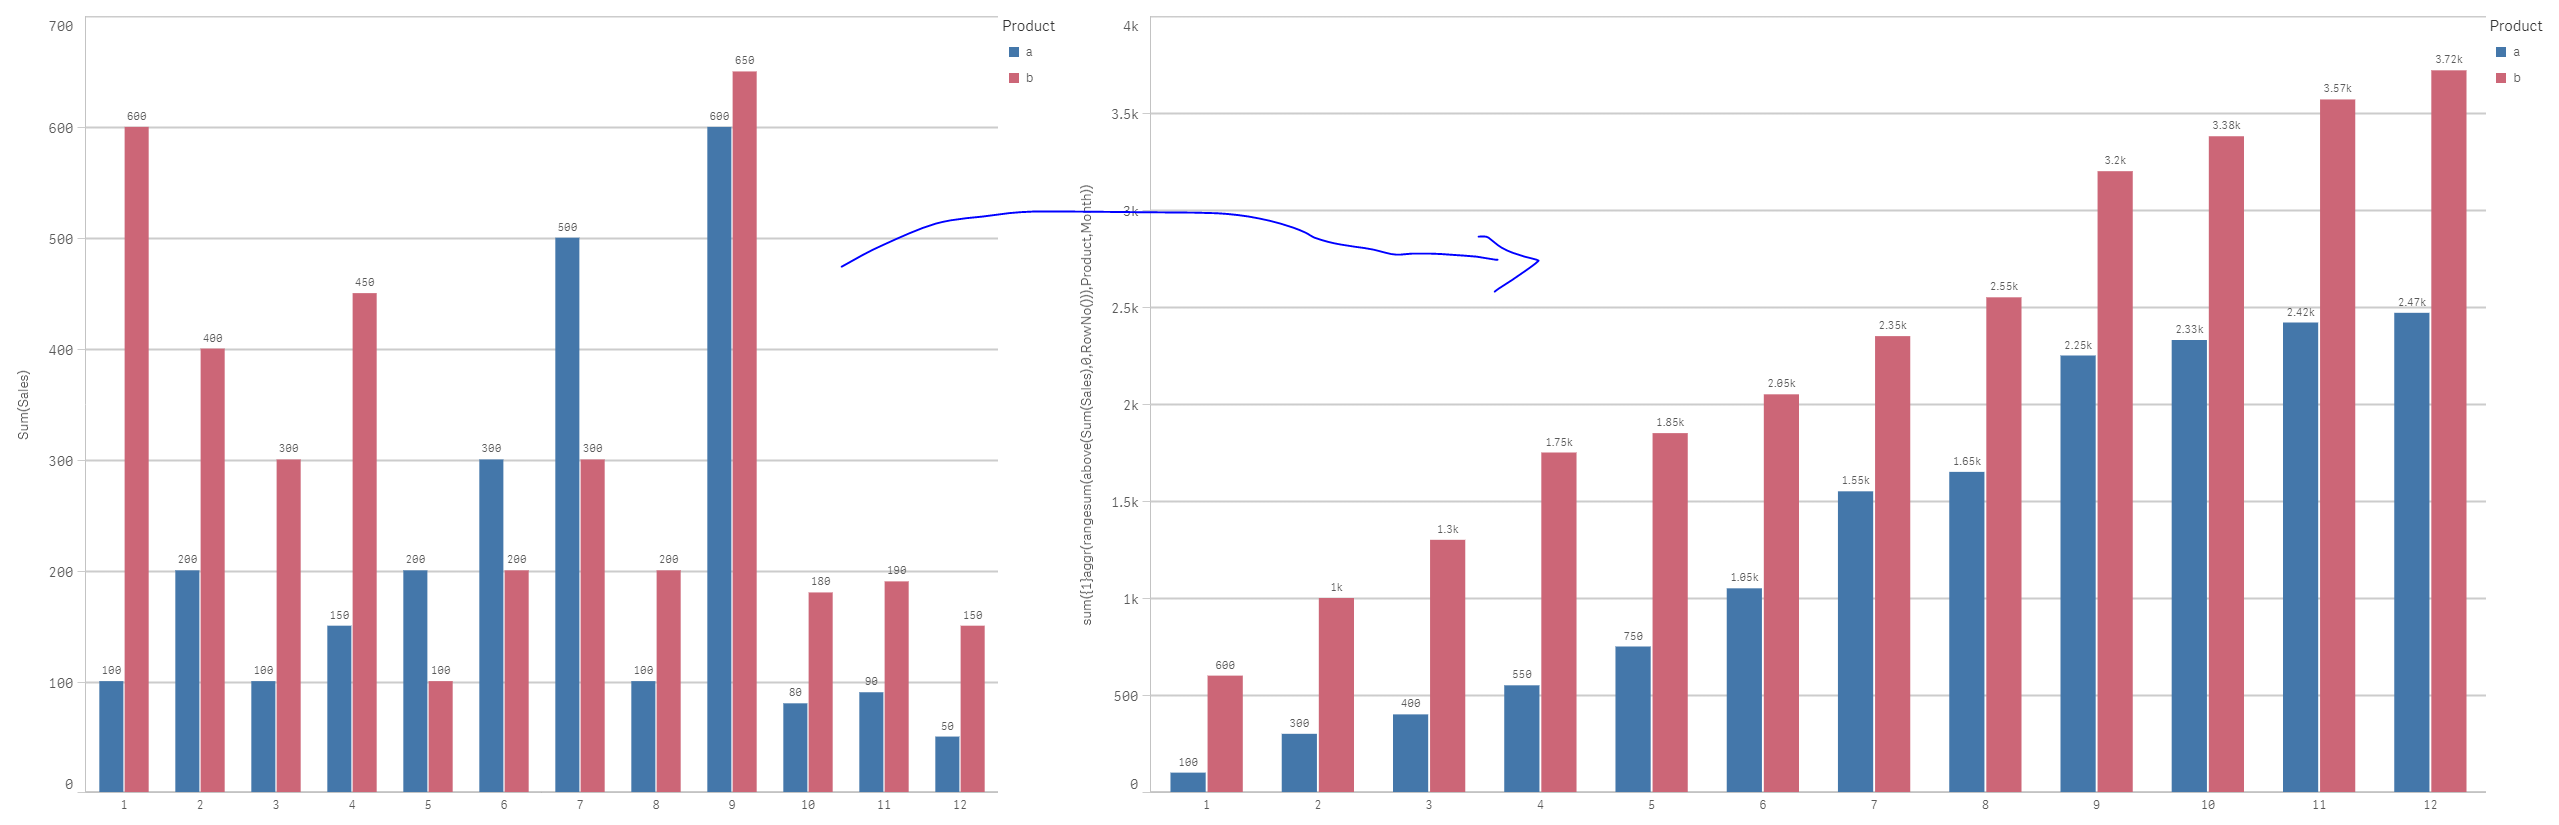
you want to eliminate the second dimension when u cumulate ur measure?
Because, the way things are with my expressions; each month; the second dimension will be cumulated..
see a and b :
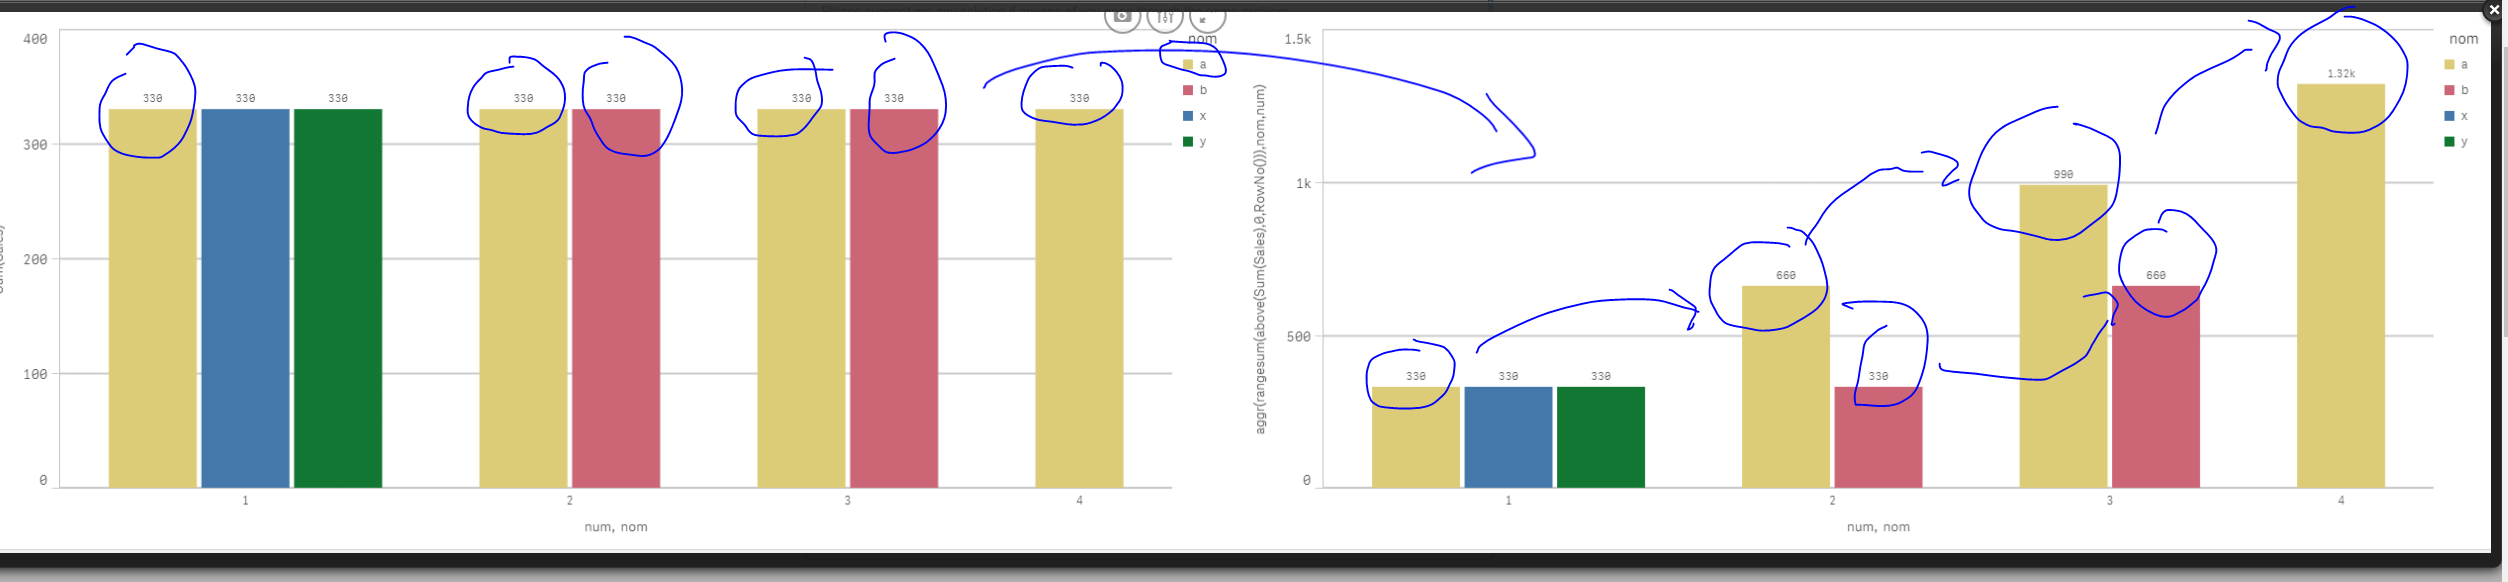
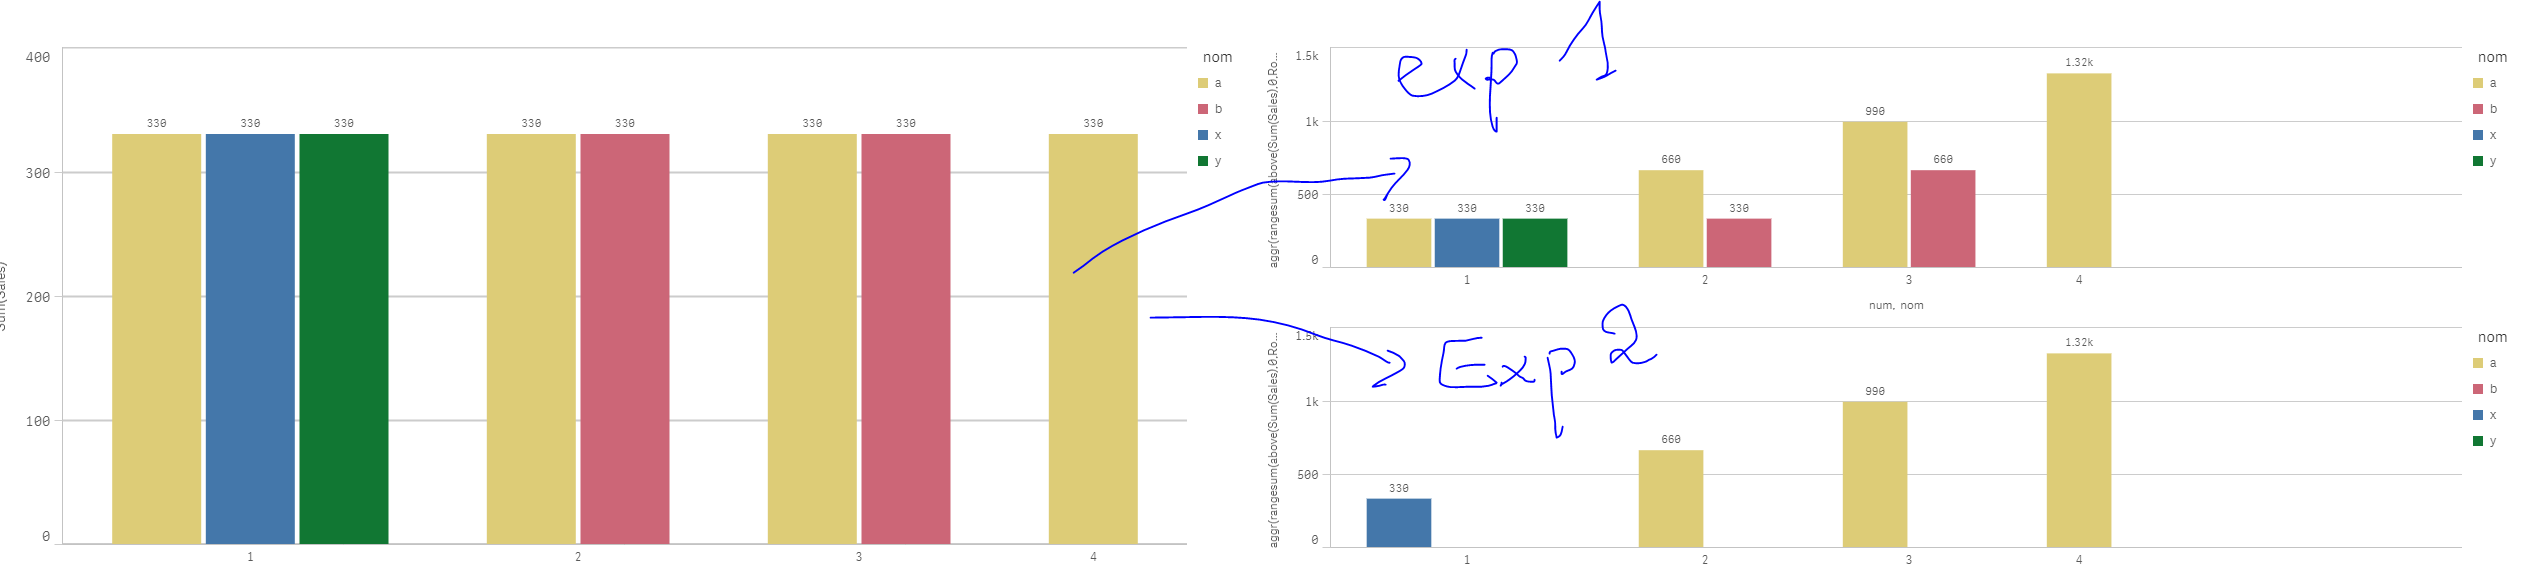
if u want to cumulate the whole thing by month and sum up all ur values of ur second dim then do as follow:
aggr(rangesum(above(Sum(Sales),0,RowNo())),Month)
result:
- Mark as New
- Bookmark
- Subscribe
- Mute
- Subscribe to RSS Feed
- Permalink
- Report Inappropriate Content
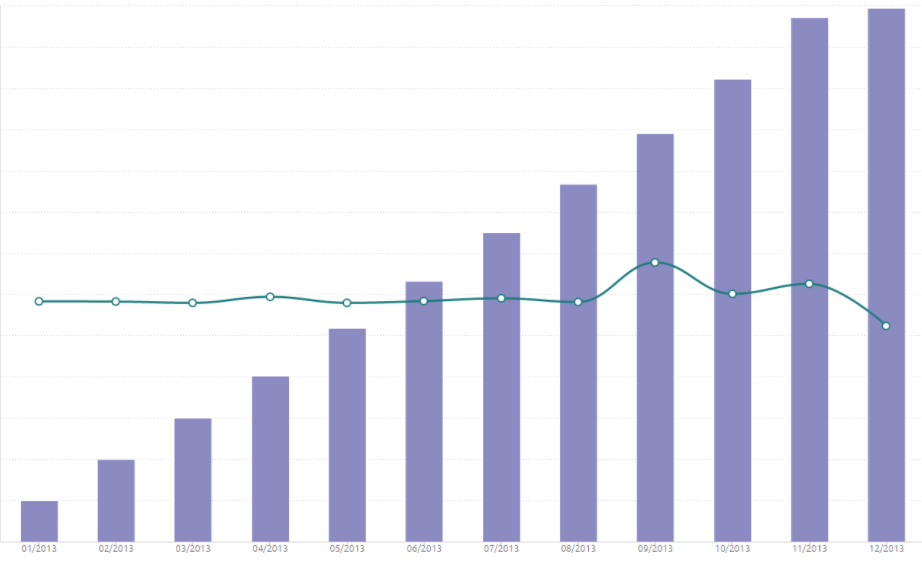
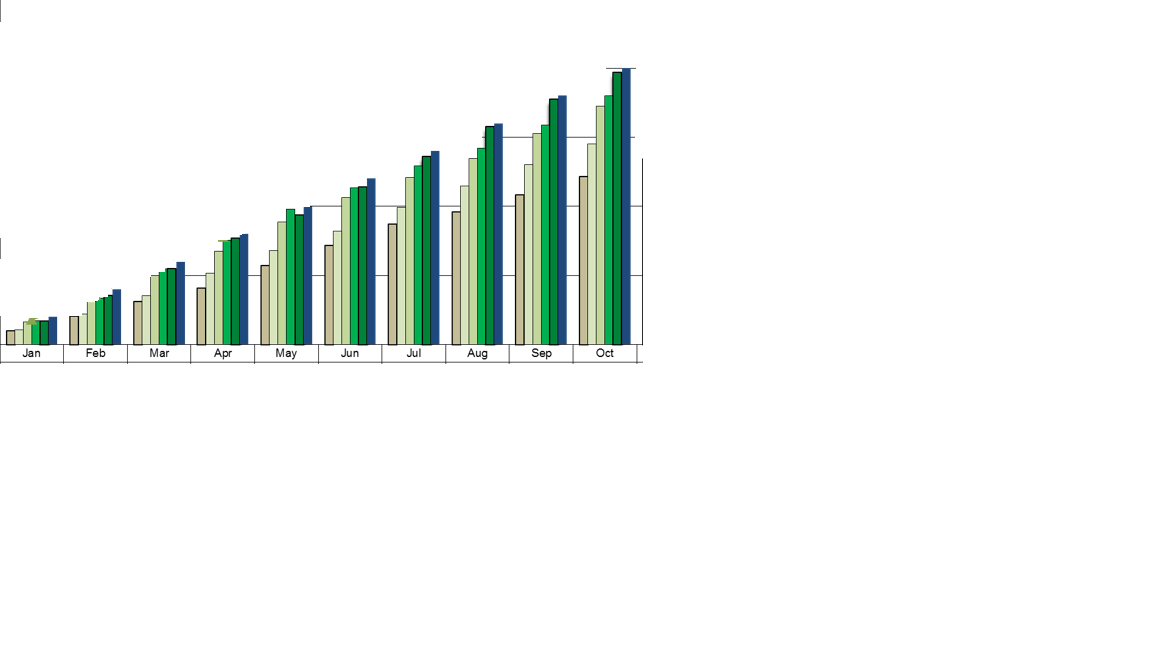
I want to cumulate the whole thing, if month Oct is selected, result should be like below picture.
aggr(rangesum(above(Sum(Sales),0,RowNo())),Month) is not working, result is the second pic.
- Mark as New
- Bookmark
- Subscribe
- Mute
- Subscribe to RSS Feed
- Permalink
- Report Inappropriate Content
can u please share a test application so I can take a look at this?
Because it works for me (without selections..)
stalwar1, how can this work with selections?
because when I select a month, qlik will this only this month and thus would not be able the above months..
Any idea?
- Mark as New
- Bookmark
- Subscribe
- Mute
- Subscribe to RSS Feed
- Permalink
- Report Inappropriate Content
- Mark as New
- Bookmark
- Subscribe
- Mute
- Subscribe to RSS Feed
- Permalink
- Report Inappropriate Content
I think Omar is right, have you tried this?
Aggr(RangeSum(Above(Sum(Sales), 0, RowNo())),Year, Month)
- Mark as New
- Bookmark
- Subscribe
- Mute
- Subscribe to RSS Feed
- Permalink
- Report Inappropriate Content
This
Only(<Month, Year>)Aggr(RangeSum(Above(Sum({<Month, Year>}Sales), 0, RowNo())),Year, Month))
- Mark as New
- Bookmark
- Subscribe
- Mute
- Subscribe to RSS Feed
- Permalink
- Report Inappropriate Content
or this
Aggr(RangeSum(Above(Sum({<Month, Year>}Sales), 0, RowNo())),Year, Month)
- « Previous Replies
- Next Replies »