Unlock a world of possibilities! Login now and discover the exclusive benefits awaiting you.
- Qlik Community
- :
- All Forums
- :
- QlikView App Dev
- :
- Line chart issue
- Subscribe to RSS Feed
- Mark Topic as New
- Mark Topic as Read
- Float this Topic for Current User
- Bookmark
- Subscribe
- Mute
- Printer Friendly Page
- Mark as New
- Bookmark
- Subscribe
- Mute
- Subscribe to RSS Feed
- Permalink
- Report Inappropriate Content
Line chart issue
hi,
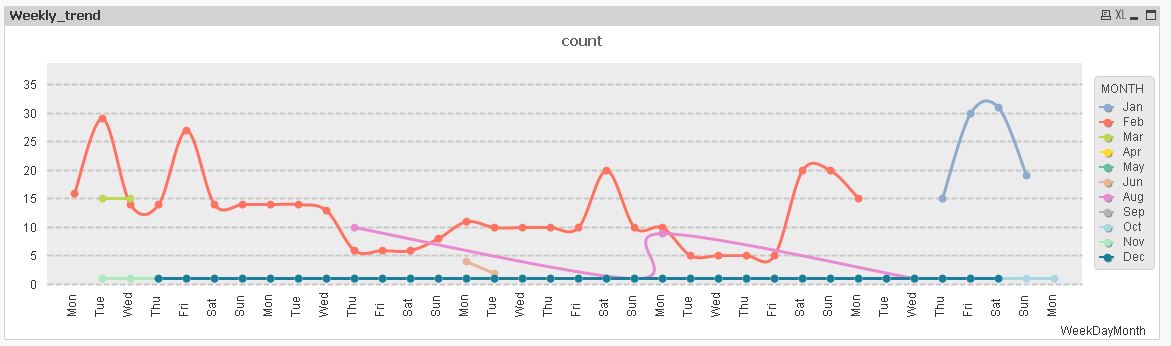
i was supposed to plot a Line chart with weekday dimension in x-axis for whole month and trend it should be like across whole year, managed to plot the weekdays but it is scrolling for whole year as shown in below screen shot but i want to plot this for 5 weeks which should look like as below. please help me out on this.


- « Previous Replies
- Next Replies »
Accepted Solutions
- Mark as New
- Bookmark
- Subscribe
- Mute
- Subscribe to RSS Feed
- Permalink
- Report Inappropriate Content
Hi,
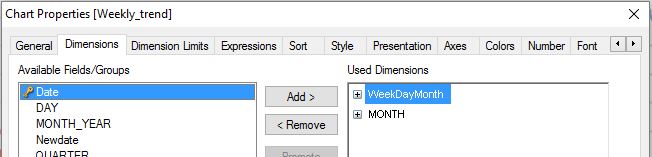
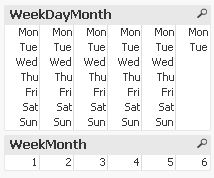
maybe one solution could be to add a dual field that represents the sequence of weekdays during a month:
Calendar:
LOAD *,
Dual(WEEK_DAY,WEEK_DAY+7*(WeekMonth-1)) as WeekDayMonth;
LOAD *,
Day(Date) as DAY,
Month(Date) as MONTH,
date(monthstart(Date), 'MMM-YYYY') as MONTH_YEAR,
Year(Date) as YEAR,
WeekDay(Date) as WEEK_DAY,
Week(Date) as WEEK_NO,
WeekName(Date) as WEEK_NAME,
AutoNumber(WeekName(Date),MonthName(Date)) as WeekMonth,
Week(weekstart(Date)) & '-' & WeekYear(Date) as WEEK_YEAR,
WeekStart(Date) as WEEK_START_YEAR,
QuarterName(Date) as QUARTER_DETAILS,
'Q' & Ceil(Month(Date)/3) as QUARTER;
LOAD
date(makedate(2016-01-01)+recno()-1,'DD-MM-YYYY') as Date
autogenerate 5000; // No Of Days In A Year //

hope this helps
regards
Marco
- Mark as New
- Bookmark
- Subscribe
- Mute
- Subscribe to RSS Feed
- Permalink
- Report Inappropriate Content
Did not understand you properly, but may be helpful for you?
- Mark as New
- Bookmark
- Subscribe
- Mute
- Subscribe to RSS Feed
- Permalink
- Report Inappropriate Content
Hi Pradeep,
Why don't u use Dimension limit Week day name for 30 as per your below chart
- Mark as New
- Bookmark
- Subscribe
- Mute
- Subscribe to RSS Feed
- Permalink
- Report Inappropriate Content
hi balraj,
let me make you understand
I want monthly trend with week name on x-axis. as i shown above in 1st screenshot. thanks in advance
- Mark as New
- Bookmark
- Subscribe
- Mute
- Subscribe to RSS Feed
- Permalink
- Report Inappropriate Content
hi Ram Sai,
by limiting dimension i guess we cant populate all weeks.
- Mark as New
- Bookmark
- Subscribe
- Mute
- Subscribe to RSS Feed
- Permalink
- Report Inappropriate Content
hi Balraj,
i am awaiting for your response, please help me out on this.
- Mark as New
- Bookmark
- Subscribe
- Mute
- Subscribe to RSS Feed
- Permalink
- Report Inappropriate Content
Hi Pradeep ,
can u post your application with sample data so that i can help to u.
- Mark as New
- Bookmark
- Subscribe
- Mute
- Subscribe to RSS Feed
- Permalink
- Report Inappropriate Content
hi Ramsai,
i don't see any option to attach the file, please advice.
- Mark as New
- Bookmark
- Subscribe
- Mute
- Subscribe to RSS Feed
- Permalink
- Report Inappropriate Content
Click on Use Advanced Editor option on Right hand side top corner after that 3 options will come
click on Attach so that u can add your file to community.
- Mark as New
- Bookmark
- Subscribe
- Mute
- Subscribe to RSS Feed
- Permalink
- Report Inappropriate Content
open ur thread on other page[tab] and right side top u will find use advance editor and clik on that u will find right down attach option
- « Previous Replies
- Next Replies »