Unlock a world of possibilities! Login now and discover the exclusive benefits awaiting you.
- Qlik Community
- :
- All Forums
- :
- QlikView App Dev
- :
- Show two values on one bar chart
- Subscribe to RSS Feed
- Mark Topic as New
- Mark Topic as Read
- Float this Topic for Current User
- Bookmark
- Subscribe
- Mute
- Printer Friendly Page
- Mark as New
- Bookmark
- Subscribe
- Mute
- Subscribe to RSS Feed
- Permalink
- Report Inappropriate Content
Show two values on one bar chart
Hi,
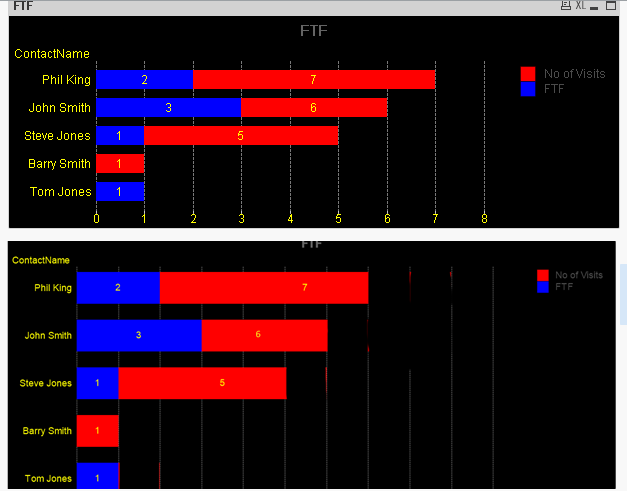
I have the attached Document which shows a a stacked bar chart using the chart wizard and another chart underneath showing the chart I wish to have but not sure it is possible.
Basically I want two values to be on the one bar chart, so the sum of VisitCount will always be higher than the the set analysis expression of FTF, if both values are the same then I would like the values to be the sum of the VisitCount and the bar to show as blue.
I hope I've explained myself clearly but you can see from the attached document the difference of where the total value of the single bar is different.
Thanks
Accepted Solutions
- Mark as New
- Bookmark
- Subscribe
- Mute
- Subscribe to RSS Feed
- Permalink
- Report Inappropriate Content
Or this
Dual(Sum(VisitCount), Sum(VisitCount)-sum( {$<FTF={1}>} VisitCount))
- Mark as New
- Bookmark
- Subscribe
- Mute
- Subscribe to RSS Feed
- Permalink
- Report Inappropriate Content
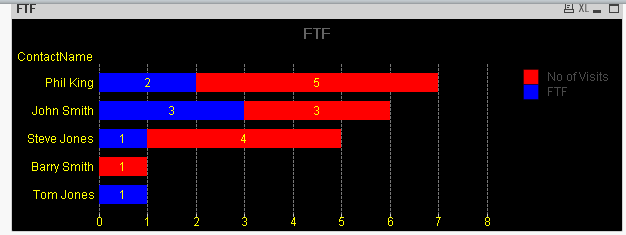
Use this for No of Visits expression
sum(VisitCount)-sum( {$<FTF={1}>} VisitCount)
- Mark as New
- Bookmark
- Subscribe
- Mute
- Subscribe to RSS Feed
- Permalink
- Report Inappropriate Content
Or this
Dual(Sum(VisitCount), Sum(VisitCount)-sum( {$<FTF={1}>} VisitCount))
- Mark as New
- Bookmark
- Subscribe
- Mute
- Subscribe to RSS Feed
- Permalink
- Report Inappropriate Content
Nice work! Thanks
- Mark as New
- Bookmark
- Subscribe
- Mute
- Subscribe to RSS Feed
- Permalink
- Report Inappropriate Content
Hi Sunny,
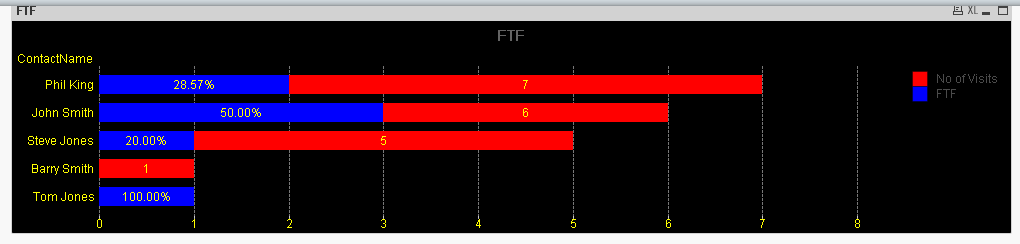
How would I change this so the FTF shows a percentage instead of a value?
Thanks
- Mark as New
- Bookmark
- Subscribe
- Mute
- Subscribe to RSS Feed
- Permalink
- Report Inappropriate Content
What values do you expect to see for FTF?
- Mark as New
- Bookmark
- Subscribe
- Mute
- Subscribe to RSS Feed
- Permalink
- Report Inappropriate Content
Hi Sunny,
So you can take "Values on Data Points" off and I would expect to see the below percentages for FTF:
Phil King - 28.57%
John Smith - 50.00%
Steve Jones - 20.00%
Barry Smith - 0.00%
Tom Jones - 100.00%
Thanks
- Mark as New
- Bookmark
- Subscribe
- Mute
- Subscribe to RSS Feed
- Permalink
- Report Inappropriate Content
Check the attached
- Mark as New
- Bookmark
- Subscribe
- Mute
- Subscribe to RSS Feed
- Permalink
- Report Inappropriate Content
Thanks Sunny! Excellent work!