Unlock a world of possibilities! Login now and discover the exclusive benefits awaiting you.
- Qlik Community
- :
- All Forums
- :
- QlikView App Dev
- :
- Is there any way to show two values on the same st...
- Subscribe to RSS Feed
- Mark Topic as New
- Mark Topic as Read
- Float this Topic for Current User
- Bookmark
- Subscribe
- Mute
- Printer Friendly Page
- Mark as New
- Bookmark
- Subscribe
- Mute
- Subscribe to RSS Feed
- Permalink
- Report Inappropriate Content
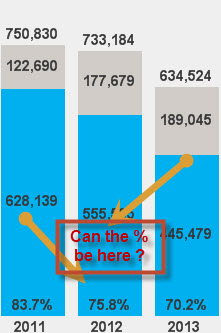
Is there any way to show two values on the same stacked bar chart ?
- Tags:
- new_to_qlikview
- « Previous Replies
-
- 1
- 2
- Next Replies »
Accepted Solutions
- Mark as New
- Bookmark
- Subscribe
- Mute
- Subscribe to RSS Feed
- Permalink
- Report Inappropriate Content
please refer attached demo
- Mark as New
- Bookmark
- Subscribe
- Mute
- Subscribe to RSS Feed
- Permalink
- Report Inappropriate Content
Hi Chen,
Please see attached qvw with three example scenarios that I have been able to come up with.
Example 1: The % is presented in Pop Up. The % is relative to each year.
Example 2: The % is presented in Pop Up. The % is relative to all years.
Example 3: I have used a Text Object with transparent background and positioned it on top of the bar chart. This is a dirty way of doing it 
Hope this will be to your help!
- Mark as New
- Bookmark
- Subscribe
- Mute
- Subscribe to RSS Feed
- Permalink
- Report Inappropriate Content
Thanks for the answer ,
The problem with the 3'rd scenario is that if you make a selection the text box stays without the bar,
as you can see from my chart all are calculated but because its in"%" then its a small numbers so it
stick them to the bottom, also I want to show every stacked bar '%', if I add another calculation it comes on top the other % calculation.
Any ide ?
TIA.
- Mark as New
- Bookmark
- Subscribe
- Mute
- Subscribe to RSS Feed
- Permalink
- Report Inappropriate Content
Yeap.
Have you tried dual value? I don't usually use it.
See that you already have a visual clue of the proportion cause they are stacked and make a total between them.
There is always the legend resource. See attachment.
I also recommend you to use variables for years, like: vActualYear =
max(Year)
Number formats are found for example in the number tab of charts. Just copy it and paste it. ‘#.##0,00%’ for Spanish version. See example in expression label.
Good luck.
- Mark as New
- Bookmark
- Subscribe
- Mute
- Subscribe to RSS Feed
- Permalink
- Report Inappropriate Content
Christian77Thanks Christian Conejero,
But you get to the same point where I'm at.
The percentage are at the bottom,
- Mark as New
- Bookmark
- Subscribe
- Mute
- Subscribe to RSS Feed
- Permalink
- Report Inappropriate Content
Ok, try this one.
Set text on axis.
You have it!!!
- Mark as New
- Bookmark
- Subscribe
- Mute
- Subscribe to RSS Feed
- Permalink
- Report Inappropriate Content
Thanks Again,
but I try all of these as you can see you put it on the axis while I want it on the bar of the chart
And if I want to show the upper bar of the stack I can't.
Maybe its not possible with qlikvew ?
That's also Ok I'll do it with other tools.
- Mark as New
- Bookmark
- Subscribe
- Mute
- Subscribe to RSS Feed
- Permalink
- Report Inappropriate Content
I think is better to have all in the same object. If you do it in different objects you will have to export all objects. When filtering, those text objects get away from their bars.
I send you another try.
1.2 use to work fine. I don't know why is not working now.
1.3 You can group expressions.
- Mark as New
- Bookmark
- Subscribe
- Mute
- Subscribe to RSS Feed
- Permalink
- Report Inappropriate Content
Thanks,
I understand it's not possible.
Will continue from that point.
- Mark as New
- Bookmark
- Subscribe
- Mute
- Subscribe to RSS Feed
- Permalink
- Report Inappropriate Content
Hi Chen,
You can use dual function
for Eg.
DUAL( NUM(Sum({$<Product={'A'}>}Sales), '£#,##0;-£#,##0') & chr(13) & NUM(Sum({$<Product={'A'}>}Sales)/Sum({$<Product={'A'}>}total Sales) , '#,##0%;#,##0%') ,Sum({$<Product={'A'}>}Sales))
and in number tab make it as Expression Default.
you will get it below number.
Thanks
Nandkishor
- « Previous Replies
-
- 1
- 2
- Next Replies »