Unlock a world of possibilities! Login now and discover the exclusive benefits awaiting you.
- Qlik Community
- :
- All Forums
- :
- QlikView App Dev
- :
- Venn Diagrams - Dynamic Selections for Objects
- Subscribe to RSS Feed
- Mark Topic as New
- Mark Topic as Read
- Float this Topic for Current User
- Bookmark
- Subscribe
- Mute
- Printer Friendly Page
- Mark as New
- Bookmark
- Subscribe
- Mute
- Subscribe to RSS Feed
- Permalink
- Report Inappropriate Content
Venn Diagrams - Dynamic Selections for Objects
Hi All,
BACKGROUND:
A few posts ago Dariusz Mielczarek was Genius enough to help me create Set Analysis variables to create a Venn Diagram
Those variables looked like this
vVennSelect1
trim(SubField(GetFieldSelections(Order_Name),',',1))
vVennCount1
count({$<Order_Name={'$(vVennSelect1)'}>} ID)
and for the intersections
vVennCount_AB
sum(aggr(if(count(DISTINCT {<Order_Name={'$(=vVennSelect1)','$(=vVennSelect2)'}>}Order_Name)=2,1,0), ID))
Along with some google expression API, i was able to create a nice Venn diagram when the user selected 2 or 3 given [Order_Name]
however after some UAT, users said they would like the Venn to work on high level detail rather than the granular detail of [Order_Name] . My Data Model has other fields with groupings such as [Order_Type] (online, mail, telephone, walkin) or [Delivery_Type] (voucher, evoucher, delivery, pickup).
QUESTION:
i'm using GetFieldSelections - is there any other way i could adjust these expressions and variables to allow the Venn Diagram to show ,based of the count of ID, using the field they are selecting on the dashboard? rather that hardcoded to one measurment [Order_Name]
Thanks.
- « Previous Replies
-
- 1
- 2
- Next Replies »
- Mark as New
- Bookmark
- Subscribe
- Mute
- Subscribe to RSS Feed
- Permalink
- Report Inappropriate Content
You could use groups and getfieldselections(GetCurrentField('groupname'))
- Mark as New
- Bookmark
- Subscribe
- Mute
- Subscribe to RSS Feed
- Permalink
- Report Inappropriate Content
Hi Matthew,
i think we may try to use concat() instead GetFieldSelections. Please attach your sample or link to old thread to let community easier find example for trying ideas 
reagrds
Darek
- Mark as New
- Bookmark
- Subscribe
- Mute
- Subscribe to RSS Feed
- Permalink
- Report Inappropriate Content
Attached is the file i cannot get to work
the blue boxes are meant to resolve the variables to see if the work but problem 1: i can resolve the intersects and problem 2: i can only seem to get this to work when i hard code a field name like ORDER_TYPE
- Mark as New
- Bookmark
- Subscribe
- Mute
- Subscribe to RSS Feed
- Permalink
- Report Inappropriate Content
Matthew,
I think, we have 2 possible ways:
1. User selects diagram level (f.i. order type, order etc.)
2. We calculate this level, finding highest level, where 2 possible
elements exists (like chart with hierarchy group dimension)
Which approach is preffered by uswest?
23-05-2014 16:44 użytkownik "matthew truslove" <qcwebmaster@qlik.com>
napisał:
Qlik Community <http://community.qlik.com/> Re: Venn Diagrams -
Dynamic Selections for Objects
reply from matthew truslove<http://community.qlik.com/people/teelovef1?et=watches.email.thread>in *New
to QlikView* - View the full discussion<http://community.qlik.com/message/534690?et=watches.email.thread#534690>
- Mark as New
- Bookmark
- Subscribe
- Mute
- Subscribe to RSS Feed
- Permalink
- Report Inappropriate Content
The best approach i think for this dashboard would be letter the user be in control of which they want to select of a minimum of one and maximum of three items per level.
- Mark as New
- Bookmark
- Subscribe
- Mute
- Subscribe to RSS Feed
- Permalink
- Report Inappropriate Content
i'm going to explore this option as well, thank you
- Mark as New
- Bookmark
- Subscribe
- Mute
- Subscribe to RSS Feed
- Permalink
- Report Inappropriate Content
Matthew,
i can imagine that:
- user selects from 1'st listbox (always one selected) diagram level. There are items like Order Name, Order Type, Delivery Type.
- there is 2'nd listbox with items deppending of selection in 1'st listbox
So, we have Island table with all possible diagram levels and with expressions we need depending of user selection.
This way our expressions are dynamic.
Let me know what do you think about this idea.
regards
Darek
- Mark as New
- Bookmark
- Subscribe
- Mute
- Subscribe to RSS Feed
- Permalink
- Report Inappropriate Content
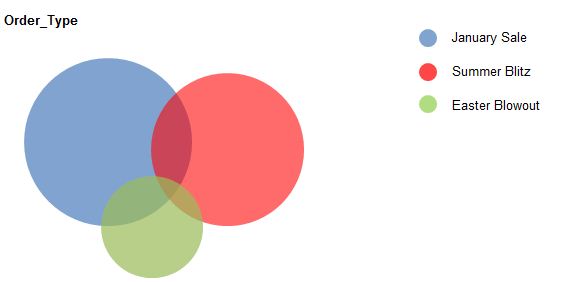
that seems like the logical approach, as long as the the venn can display the crossovers like below.
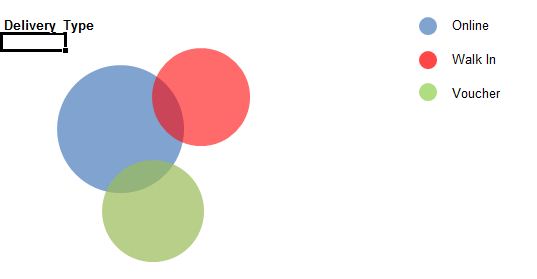
or when they choose another level it may look like this
- Mark as New
- Bookmark
- Subscribe
- Mute
- Subscribe to RSS Feed
- Permalink
- Report Inappropriate Content
as we can see in the first diagram some customer ordered something from all 3 order_type where as the 2nd diagram show that the customers never choose all 3 deleivery methods
- « Previous Replies
-
- 1
- 2
- Next Replies »