Unlock a world of possibilities! Login now and discover the exclusive benefits awaiting you.
- Qlik Community
- :
- Support
- :
- Support
- :
- Knowledge
- :
- Support Articles
- :
- How to: Getting started with the Splunk connector ...
- Subscribe to RSS Feed
- Mark as New
- Mark as Read
- Bookmark
- Subscribe
- Printer Friendly Page
- Report Inappropriate Content
How to: Getting started with the Splunk connector in Qlik Application Automation
- Mark as New
- Bookmark
- Subscribe
- Mute
- Subscribe to RSS Feed
- Permalink
- Report Inappropriate Content
How to: Getting started with the Splunk connector in Qlik Application Automation
This article gives an overview of the Splunk Connector in Qlik Application Automation.
The Splunk connector has been created with the following use cases in mind:
- Being able to perform searches to a Splunk instance
- Inserting new events into Splunk using the HTTP Event Collector
Connecting the Splunk connector
The Splunk connector makes use of basic authentication. When connecting the connector, you will be prompted with the following popup screen:
Hostname: The hostname or IP address of the Splunk instance. Exclude the http(s):// part and the port number of the URL.
Username: The username you use to login to Splunk
Password: The password you use to login to Splunk
Use SSL: Select whether the management service of Splunk makes use of SSL. Default yes.
Management port: The port on which the management service of Splunk is running. Default is 8089. Providing no value will omit the port from the final URL.
Performing a search on Splunk
To perform searches using the Splunk connector it is possible to perform a synchronous search as well as an asynchronous search. The synchronous search has a timeout of 50 seconds, with the asynchronous search it is possible to have a longer window before the automation will timeout.
Synchronous Search
The synchronous search can be done using the Synchronous Search block. In the Search Query block you will have to provide a splunk search query.
Asynchronous Search
The asynchronous search block can be manually done using the block Asynchronous Search block. Then perform polling using the Get Search block using the returned Search ID. When finished, results can be obtained using the Get Results From Search block.
Alternatively it is possible to use the block Do Asynchronous Search and get Results. This block will perform the polling, only a search query has to be provided to obtain a list of results.
Sending data into Splunk
The other use of the Splunk connector is to send data into Splunk by making use of the HTTP Event Collector. An example usecase for this would be to send reload logs of a Qlik Sense app into Splunk.
To do this we will first have to create an HTTP Event Collector on the Splunk side.
To do this in Splunk go to Splunk in the web browser and go to Settings > Data > Data Inputs.
On this page you will see Http Event Collector. Press the Add new button.
Provide a name for the token and go to the next page. Select indexes to which this token can write. Click on Review and Submit. You will be given a token that you need to configure on the block.
In Qlik Application Automation make use of the Send Event block. For the inputs, enter the HEC token value. Provide the port for the HTTP event collector. This can be obtained from the Splunk HTTP Event Collector page when clicking on the Global Settings button. You can also find whether SSL is enabled for the HTTP Event Collector, select this value for the Hec_Use_Ssl parameter. Next, provide the index to which you're writing your events and provide a source string.
For data, you can map JSON message in the Event parameter.
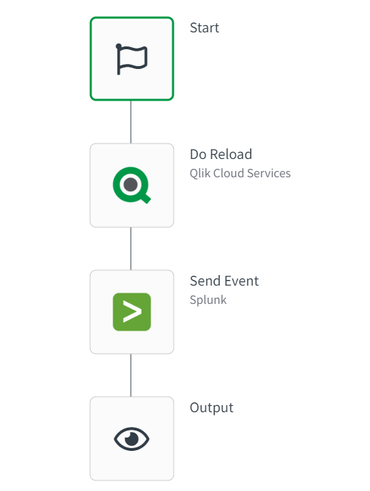
The following example will perform a reload and send the reload log to Splunk:
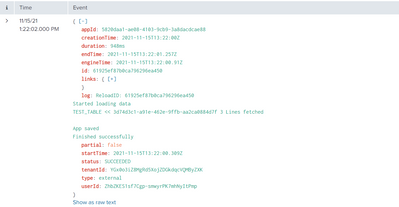
In Splunk it is then possible to view the logs of the reload:
The information in this article is provided as-is and to be used at own discretion. Depending on tool(s) used, customization(s), and/or other factors ongoing support on the solution below may not be provided by Qlik Support.
- Mark as Read
- Mark as New
- Bookmark
- Permalink
- Report Inappropriate Content
Hi @MarkGeurtsen, thanks for this how-to!
In your opinion, is it the right way to use the automation to insert in Splunk the Qlik Cloud logs (tracked in "Events")? Is there any already explored use case to make it? I have a doubt about developing a custom component that extracts logs from Qlik Cloud and pushes them to Splunk or instead developing a Qlik Automation.
Qlik Cloud Qlik Application Automation
Thanks,
EP
- Mark as Read
- Mark as New
- Bookmark
- Permalink
- Report Inappropriate Content
Is it possible to access session logs on Qlik SaaS and send those to Splunk?
- Mark as Read
- Mark as New
- Bookmark
- Permalink
- Report Inappropriate Content
Hello @mgranillo
As the session information is exposed to you, this should be possible to do just as with the reload logs. For general setup assistance, however, I need to point you in the direction of the Application Automation forums.
All the best,
Sonja


