Unlock a world of possibilities! Login now and discover the exclusive benefits awaiting you.
- Qlik Community
- :
- Support
- :
- Support
- :
- Knowledge
- :
- Support Articles
- :
- How to generate a trace for the HTTP requests exec...
- Subscribe to RSS Feed
- Mark as New
- Mark as Read
- Bookmark
- Subscribe
- Printer Friendly Page
- Report Inappropriate Content
How to generate a trace for the HTTP requests executed by Studio
- Mark as New
- Bookmark
- Subscribe
- Mute
- Subscribe to RSS Feed
- Permalink
- Report Inappropriate Content
How to generate a trace for the HTTP requests executed by Studio
Feb 6, 2024 10:10:57 AM
Apr 22, 2022 9:51:37 AM
Question
How do you generate a trace of the HTTP requests executed by the Talend Studio without using a third-party tool?
Answer
1. Create a logging.properties file (in the c:\temp folder for example) containing the following lines:
.level=FINEST
handlers = java.util.logging.FileHandler
java.util.logging.FileHandler.pattern = c:/temp/debug.txt
java.util.logging.FileHandler.limit = 20480KB
java.util.logging.FileHandler.count = 10
java.util.logging.FileHandler.append = true
java.util.logging.FileHandler.formatter = java.util.logging.SimpleFormatter
2. Create a log4j.properties file (in the c:\temp folder for example) containing the following lines:
log4j.rootLogger=INFO, stdout
log4j.appender.stdout=org.apache.log4j.ConsoleAppender
log4j.appender.stdout.layout=org.apache.log4j.PatternLayout
log4j.appender.stdout.layout.ConversionPattern=%d{yyyy-MM-dd HH:mm:ss} %-5p %c{1}:%L - %m%n
log4j.logger.org.apache.http=DEBUG
log4j.logger.org.apache.http.wire=DEBUG
Note: the trace generated does not contain all the body of the HTTP requests. If you want to log the body of the HTTP requests and responses, use a HTTP proxy, such as Fiddler.
3. Start Talend Studio by using the following commands:
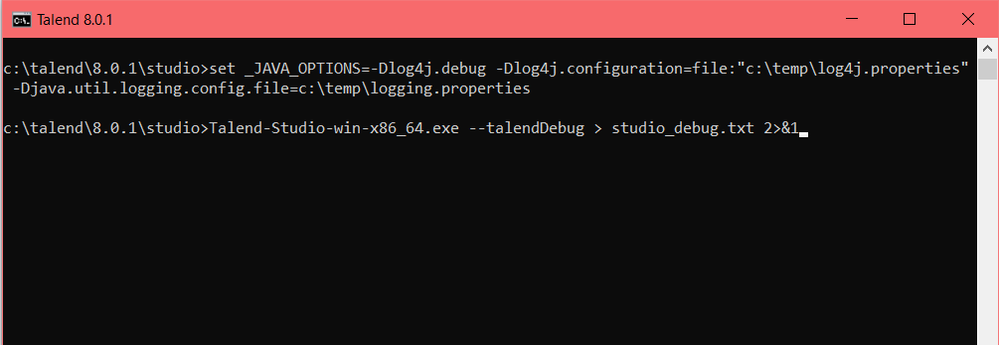
On Windows : from a CMD window , execute the following 2 commands :
set _JAVA_OPTIONS=-Dlog4j.debug -Dlog4j.configuration=file:"c:\temp\log4j.properties" -Djava.util.logging.config.file=c:\temp\logging.properties
Talend-Studio-win-x86_64.exe --talendDebug > studio_debug.txt 2>&1

On Linux : from a shell terminal , execute the following 2 commands :
export _JAVA_OPTIONS='-Dlog4j.debug -Dlog4j.configuration=file:"/tmp/log4j.properties" -Djava.util.logging.config.file=/tmp/logging.properties'
Talend-Studio-linux-gtk-x86_64 --talendDebug > studio_debug.txt 2>&1
NOTE : On Linux , "adapt" the file logging.properties :
java.util.logging.FileHandler.pattern = /tmp/debug.txt