- Mark as New
- Bookmark
- Subscribe
- Mute
- Subscribe to RSS Feed
- Permalink
- Report Inappropriate Content
How to get started with the PagerDuty connector in Qlik Application Automation
This article provides an overview of the available blocks in the PagerDuty connector in Qlik Application Automation.
PagerDuty integrates data from multiple monitoring systems into a single view. When a problem occurs, the PagerDuty configuration ensures that the team member who is best able to fix it at the time is notified.
Authentication
Authentication to PagerDuty happens through API Key Authentication. To use this connector, you need to provide the API key from your PagerDuty account.
How to get the API Key :
1. In the PagerDuty web app, navigate to Integrations -> API Access Keys under Developer Tools.
2. Click Create New API Key.
3. Enter a Description to help you identify the key later.
*Optionally check Read-only API Key if you’d like the key to only make GET calls.
4. Click Create Key.
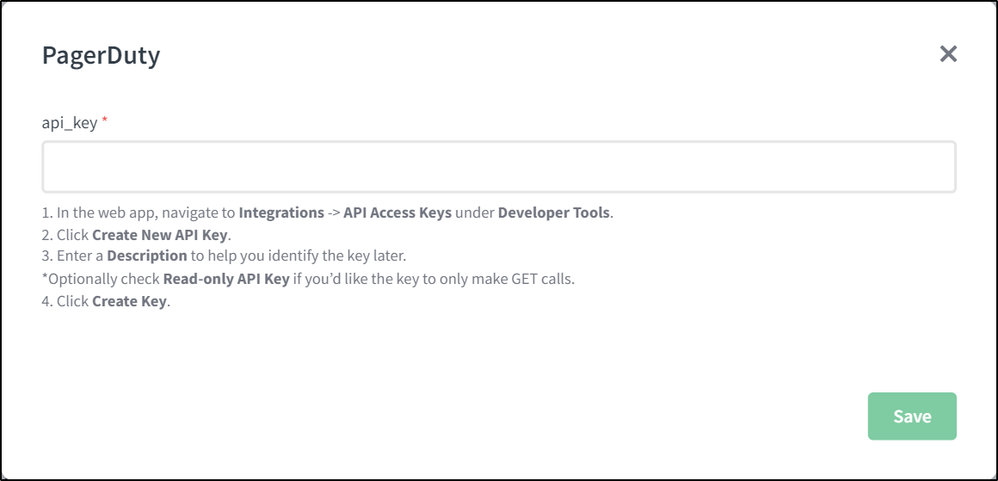
When you connect to PagerDuty in Qlik Application Automation you will be presented with the following screen:
Enter the API Key you obtained in the space above and you will be connected to your PagerDuty account.
Available Blocks
The following blocks are available in PagerDuty Connector:
Change Event Endpoints
- create change event
- update change event
- get change event
- list change events
Incident Endpoints
- create incident
- update incident
- get incident
- list incidents
Log Entries Endpoints
- update log entry channel information
- get log entry
- list log entries
Notification Endpoint
- list notifications
Services Endpoints
- create service
- update service
- get service
- list services
- delete service
Tag Endpoints
- create tag
- get tag
- list tags
- delete tag
- get tags for entities
User Endpoints
- create user
- update user
- get user
- list user
- delete user
We also have webhooks configured for the following incident events:
- "incident.acknowledged"
- "incident.annotated"
- "incident.delegated"
- "incident.escalated"
- "incident.priority_updated"
- "incident.reassigned"
- "incident.reopened"
- "incident.resolved"
- "incident.responder.added"
- "incident.responder.replied"
- "incident.triggered"
- "incident.unacknowledged"
Now let's go over an example. Let's try to list all the incidents.
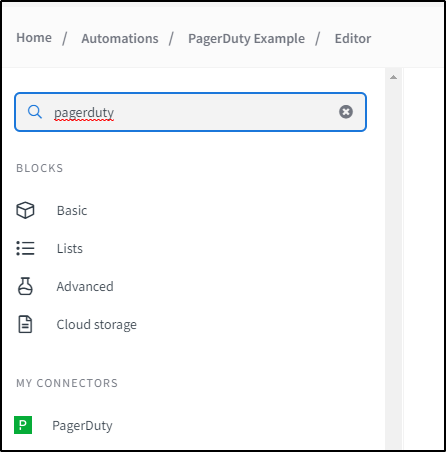
- After connecting the datasource, search for the PagerDuty connector in the left panel.
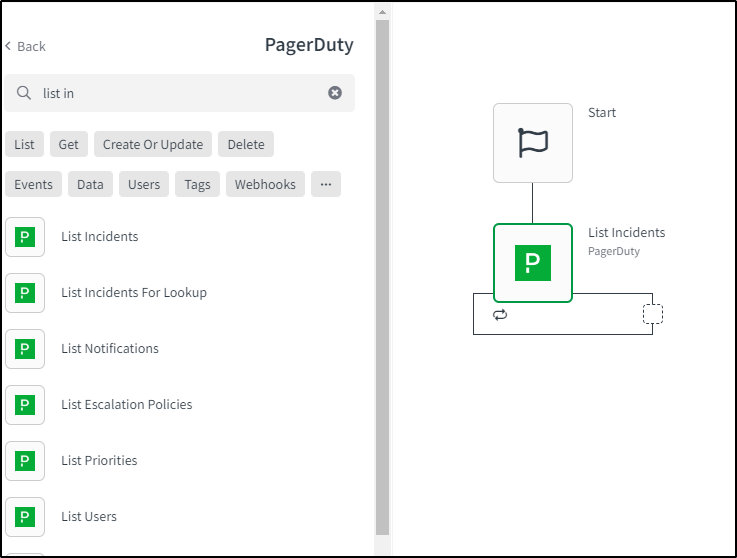
- Search for the 'List Incidents' block in the PagerDuty connector and drag it onto the canvas.
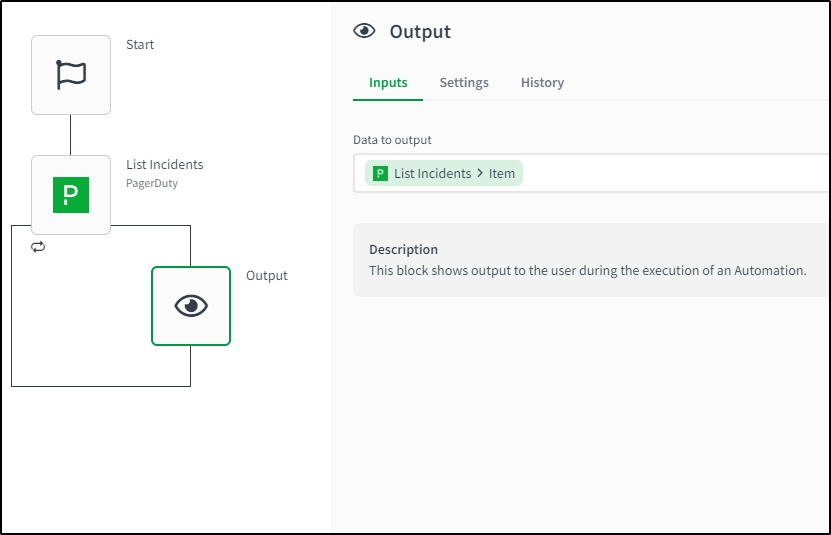
- Drag the 'Output' block from under the Basic blocks filter and place it inside the 'List Incidents' blocks loop.
-
Run the automation and you will see the list of incidents from your account.
The information in this article is provided as-is and to be used at own discretion. Depending on tool(s) used, customization(s), and/or other factors ongoing support on the solution below may not be provided by Qlik Support.


