Unlock a world of possibilities! Login now and discover the exclusive benefits awaiting you.
- Qlik Community
- :
- Support
- :
- Support
- :
- Knowledge
- :
- Support Articles
- :
- Latency / Performance Troubleshooting and Tuning f...
- Subscribe to RSS Feed
- Mark as New
- Mark as Read
- Bookmark
- Subscribe
- Printer Friendly Page
- Report Inappropriate Content
Latency / Performance Troubleshooting and Tuning for Replicate
- Mark as New
- Bookmark
- Subscribe
- Mute
- Subscribe to RSS Feed
- Permalink
- Report Inappropriate Content
Latency / Performance Troubleshooting and Tuning for Replicate
Mar 25, 2026 10:54:25 AM
Aug 7, 2020 9:22:46 AM
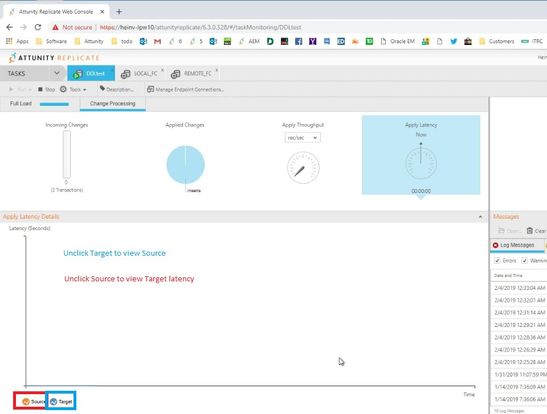
Using the Replicate UI check to see if the Latency is on the Source or the Target:
Source Latency steps to determine root cause:
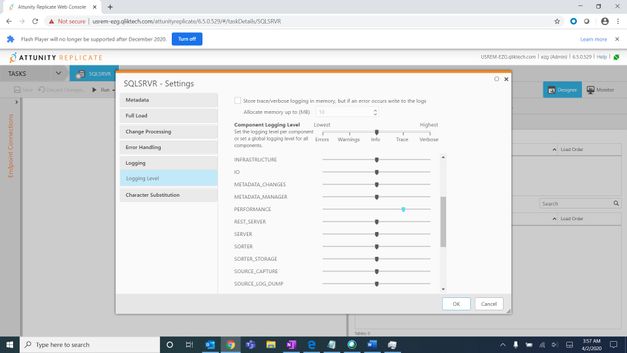
Enable performance logging to trace (This should be set to one hour, it is at best effort, we will not write until after a bulk is done, so it might be longer than the setting (1 hr).
You can also go to statistics (edit the task settings --> control tables --> "Replication History" attrep_history check this on).
(A quick way to determine is to look) On the GUI on the incoming changes look at if there is a waiting for target apply (100k - millions).
Source Tracing is normally this is architectures related (the different endpoints are very different.)
Be sure to use the null target (hold control when hitting "manage endpoints" to be able to select a null target). Use this to take sorter out of the equation and target out of the equation.
Calculating Source Latency:
When a time period passes with no changes applied to the target, the latency calculation is based on the time difference between the current time and the timestamp of the last change event read from the transaction log. This could happen if, for example, there is high activity on tables that are not selected for replication in the current task.
Source Latency can be also checked using SOURCE_CAPTURE set to VERBOSE and get the query being run and capture this out of the Log and run from the Client to the Source using the same Connection defined in the Source Endpoint.
TIP:
Be sure to use the null target (hold control when hitting "manage endpoints" to be able to select a null target). Use this to take sorter out of the equation and target out of the equation.
Target Latency:
Bulk tuning
- Low Volume Targets: OLTP
- High Volume targets OLAP: Vertica, Netezza, Snowflake (the price is that the single commits are slow)
- Bulk size should be 30 minutes’ worth of changes
- Longer than (seconds): 1 -- default
- But less than (seconds): 30 -- default
- Force apply a batch when processing memory exceeds (MB): 500 -- default
- IMPORTANT:
Sometimes a reload is a far better option, take the problem table out of the task, make sure all is going well than fully reload the problem table. Also a Full Load and back to CDC Mode it potentially is faster if the Latency is 20+ Hours as Example
How slow is it? Look for 'to seq' in the log to see the time between applies.
Are we in transactional or batch apply mode (search for 'mode' in the log)
- This task was a full load or CDC we need to know
- The other result will be if it is in Batch (bulk apply) or transactional
A batch can only work with the relational target, File target for example needs to be transactional, and you should specify this to access all the transactional tuning options.
If we find that we are kicked out of batch apply, then look just above in the log for the reason we are kicked out of Batch apply. With Batch apply we are not sure which record(s) caused us to error, so we try one at a time to switch to Transactional Apply.
Record not found for UPDATE or DELETE
(we may ignore these based on task setting BUT we still must go into 1-1 mode)
Look at target_apply_exceptions table on the target. This can give a reason why applys are failing. This is REQUIRED for troubleshooting. A summary of the rate of errors with something like this:
Please provide an overview along the lines of.
SELECT COUNT ... TASK, TABLE, OPERATION, ERROR_code WHERE ERROR_TIME > '2019-01-01'

GROUP and ORDER by HOUR, TASK, TABLE, OPERATION, ERROR
How long does a typical apply take?
Search for 'Batch' in the output of the script to see WHY the batch closed (Time or memory?)
Are we performing LOB lookups? Target will need this, and it will go back to the source_capture for this information. This information will be found in the target_apply logging. We will only fetch one lob at a time. Because we only do one at a time it is very expensive. If the task is NOT using limited LOB support, then this will result in LOB lookups and limit the throughput. If LOB lookups are suspected be sure to work with the source DBA b/c they should show the volume and effectiveness of the execution plan. If the plan is problematic the DBA may decide to optimize.
Transformation (GUI and log) and manipulation (JSON) Source_lookup or target_lookup. This can cause a lot of cost to the process. If you see this in the log have the DBA look for high volume and high cost queries driven by the replicate user or service username.
Are there primary keys? Look at the DDL for the Source and Target should be same for optimal performance (Indexes, PK’s, FK’s).
Keys: For optimal performance please ensure that all tables being replicated have either a primary key or a unique index.
Look for timeouts if you are getting timeouts then there are probably inefficiencies in the table that is being replicated to. Example:
00002116: 2019-02-28T14:42:09 [TARGET_APPLY    ]T:  sqlserver_endpoint_free_imp(...) Safeguard found inactive.  (sqlserver_endpoint_imp.c:2301)^M

00002116: 2019-02-28T14:42:09 [TARGET_APPLY    ]E:  Failed (retcode -1) to execute statement: 'DELETE  FROM [rdr].[SomeCustomerTable] FROM some big sql statement here  (ar_odbc_stmt.c:2604)^M

00002116: 2019-02-28T14:42:09 [TARGET_APPLY    ]E:  RetCode: SQL_ERROR  SqlState: HYT00 NativeError: 0 Message: [Microsoft][SQL Server Native Client 11.0]Query timeout expired [1022502]  (ar_odbc_stmt.c:2610)^M

00002116: 2019-02-28T14:42:09 [TARGET_APPLY    ]E:  Failed to execute delete statement.
Replicate server: Eyeball the replicate server resources
CPU: more than 50% this might be an issue.
Pay attention to the process associated with the task (command line) whether it is consuming more than 1 core. At CDC we expect to use around 1/2 CPU. If we are using more than that it is probably excessive manipulations/transformations.
Memory: higher than 80% is a problem
IO / disk usage (if we spill to disk the problem can cascade)
Look in the task's sorter directory are the files growing for high activity and not coming down.
Sorter files are created if the data has been in memory for more than 60 seconds. This is configurable and it may make sense to alter this setting.
Network / DISK:
The best option for Optimal Performance to having collated Qlik Data Integration installed within the same Subnet / Data Center the Source and possibly the Target.
Linux:
Is the Disk Mount for Data Directory of QDI Server is only being used by QDI? This is recommended for file access and no other overhead by other applications to save on Disk I/O and possible contention.
Windows:
Applied to the share / nfs for the QDI Data Directory be defined for the Replicate Server. If notice issue can open Windows Task Manager and check the CPU for the repctl command running and the Disk I/O for the Reads and Writes to the Data Directory.
Apply:
2k - 5k apply rate is good
Drill into the problem side:
If target set to target apply to trace
If source set source capture to trace
Check to see if any data flowing?
SQL Server: Check to see is the events line that is supposed to appear events line
(On info level of our log every 2 mins IF data is flowing) ?
Oracle and MySQL (possibly others): Are re-do etc rolling over? (This does not work for SQL Server is harder to see if it rolls over or not) "Change of log sequence number" in our logs at info level
The creation of the NULL/TARGET helps isolate issues and confirms Data is flowing. If using the NULL/TARGET this also could be due to a SOURCE issue. Setting SOURCE_CAPTURE and TARGET_APPLY to VERBOSE show details for both Source and Target Endpoints.
Questions that might be asked by Support:
What are the last logs successfully processed, what is the next log file to be processed?
This will be in trace of source capture set to VERBOSE.
Are we not keeping up with the volume?
Are we using a DB reader or a native reader?
Oracle: log miner vs. Binary (Look in JSON)
SQL: dump_db_log vs Binary (look in JSON)
If Oracle is sure to use ASM see the below section:
Settings for Endpoint:
Use the below parameters on the Endpoint and Advanced Settings:
Recommendations: for Optimal Performance on the Endpoint Settings and
Internal Parameter:
On the ASM Settings set the below parameters:
parallelASMReadThreads 8
readAheadBlocks is 500000
Advanced Options:
Internal Parameter:
asmUsePLSQLArray parameter
Note: When you are having a Performance issue with Oracle Source you can turn on the PERFORMANCE component to TRACE as this will show the MS it is taking to access the Redo Logs. It is also a good idea if possible, to have the Replicate Server in the same Data Center the Oracle DBMS being accessed.
Oracle Query to check how much data being in the Logs and the size:
How much data has changed recently and trending day over a day along with the size of the Redo Logs location and how they are being accessed?
In order to check log switches information:
SELECT

to_char(first_time,'YYYY-MON-DD') day,

to_char(sum(decode(to_char(first_time,'HH24'),'00',1,0)),'99') "00",

to_char(sum(decode(to_char(first_time,'HH24'),'01',1,0)),'99') "01",

to_char(sum(decode(to_char(first_time,'HH24'),'02',1,0)),'99') "02",

to_char(sum(decode(to_char(first_time,'HH24'),'03',1,0)),'99') "03",

to_char(sum(decode(to_char(first_time,'HH24'),'04',1,0)),'99') "04",

to_char(sum(decode(to_char(first_time,'HH24'),'05',1,0)),'99') "05",

to_char(sum(decode(to_char(first_time,'HH24'),'06',1,0)),'99') "06",

to_char(sum(decode(to_char(first_time,'HH24'),'07',1,0)),'99') "07",

to_char(sum(decode(to_char(first_time,'HH24'),'08',1,0)),'99') "08",

to_char(sum(decode(to_char(first_time,'HH24'),'09',1,0)),'99') "09",

to_char(sum(decode(to_char(first_time,'HH24'),'10',1,0)),'99') "10",

to_char(sum(decode(to_char(first_time,'HH24'),'11',1,0)),'99') "11",

to_char(sum(decode(to_char(first_time,'HH24'),'12',1,0)),'99') "12",

to_char(sum(decode(to_char(first_time,'HH24'),'13',1,0)),'99') "13",

to_char(sum(decode(to_char(first_time,'HH24'),'14',1,0)),'99') "14",

to_char(sum(decode(to_char(first_time,'HH24'),'15',1,0)),'99') "15",

to_char(sum(decode(to_char(first_time,'HH24'),'16',1,0)),'99') "16",

to_char(sum(decode(to_char(first_time,'HH24'),'17',1,0)),'99') "17",

to_char(sum(decode(to_char(first_time,'HH24'),'18',1,0)),'99') "18",

to_char(sum(decode(to_char(first_time,'HH24'),'19',1,0)),'99') "19",

to_char(sum(decode(to_char(first_time,'HH24'),'20',1,0)),'99') "20",

to_char(sum(decode(to_char(first_time,'HH24'),'21',1,0)),'99') "21",

to_char(sum(decode(to_char(first_time,'HH24'),'22',1,0)),'99') "22",

to_char(sum(decode(to_char(first_time,'HH24'),'23',1,0)),'99') "23"


From


V$log_History Where Trunc(First_Time) Between


                        trunc(to_date('01.04.2017', 'dd.mm.yyyy'))

             And

                        trunc(to_date('03.04.2017', 'dd.mm.yyyy'))


Group By


                          to_char(first_time,'YYYY-MON-DD');
Support may Request below information:
What is normal latency for the problem Task?
Is it a source or target or handler?
Is it sudden or has the performance been getting worse over time?
Logs performance at trace, either source or target at trace?
All relevant information from steps above for specifics.
DDL source and target comparing Primary Keys / Indexes none are missing?
Sample Scripts:
There are sample scripts attached written in Perl Script that will need to install Perl on the Machine you want to use for reporting performance related reports on the Tasks. Each sample has the required Log level settings needed to read in the Logs to output the results. The Scripts are generic Performance of the Apply Summary and can be used with most Endpoints.
Note: Because these are posted to this Performance Trouble Shooting Guide this is compiled and linked using the Source coding for the language it's written in (Perl Script) and is run at users own debugging input and can supply to Support.
Attached are Samples of Apply Summary with Oracle Source ASM Performance and ASM Read:
Open the Task having the Performance-related issue and enable PERFORMANCE Component to TRACE. Save and allow the process to run for historical information you can use the new Log created into the attached Perl Scripts.
Note: Please also reference the Change Processing Tuning and Full Load Tuning sections in the Replicate User Guide for options available for your tuning exercise.

