Unlock a world of possibilities! Login now and discover the exclusive benefits awaiting you.
- Qlik Community
- :
- Support
- :
- Support
- :
- Knowledge
- :
- Support Articles
- :
- Troubleshooting Qlik Application Automation
- Subscribe to RSS Feed
- Mark as New
- Mark as Read
- Bookmark
- Subscribe
- Printer Friendly Page
- Report Inappropriate Content
Troubleshooting Qlik Application Automation
- Mark as New
- Bookmark
- Subscribe
- Mute
- Subscribe to RSS Feed
- Permalink
- Report Inappropriate Content
Troubleshooting Qlik Application Automation
Sep 23, 2024 7:09:50 AM
Dec 20, 2022 7:59:04 AM
Need to debug an automation? This guide walks you through troubleshooting tips for Qlik Application Automation.
Content:
- Download Workspace
- Automations Overview History Tab
- Block History Tab
- Export This Run Button in Automations Overview Tab
- Chronologically Tab in Automations Overview Tab
- Error Tab In Automations Overview Tab
- Per Block Tab in Automations Overview Tab
- Show API Endpoint link
- Locating an Automation ID
- Automation Run ID
- Connection Run ID
- Environment
Download Workspace
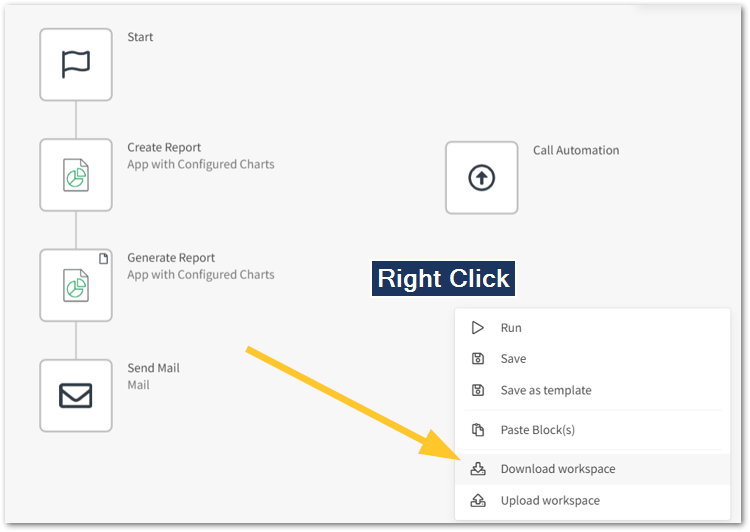
While in the automation editor block screen, right-click in a blank space and click Download workspace.
This option will generate a JSON file representing the automation itself with all its blocks and their corresponding inputs.
This JSON file can be used in debugging for:
Understanding the different blocks which are used in the automation:
- how they run
- with which inputs they run
- and what their outputs are
In addition, the downloaded workspace can be sent to Qlik Support to recreate a copy of the automation, including identical blocks. While this will not allow for access to eventual connections configured in the blocks, it makes recreating the automation for troubleshooting purposes simpler.
This option works in conjuction with the Upload Workspace option, which can be found in the same drop-down menu as Download Workspace. To upload an automation, simply create a blank automation and right-click on the block editor page and click on the option Upload Workspace.
Automations Overview History Tab
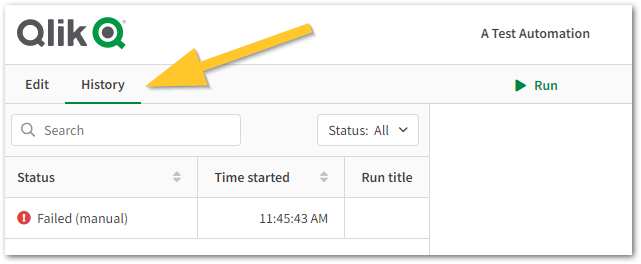
Open an automation and click the History tab.
This provides an overview of all automation runs:
- when they started,
- when they were scheduled to start,
- the current run status,
- and how long did it take to complete the run.
Clicking on a run will show its ID in the URL, which can be further used to troubleshoot.
This view can help pinpoint specific instances of automation executions that were in error either previously or currently.
Block History Tab
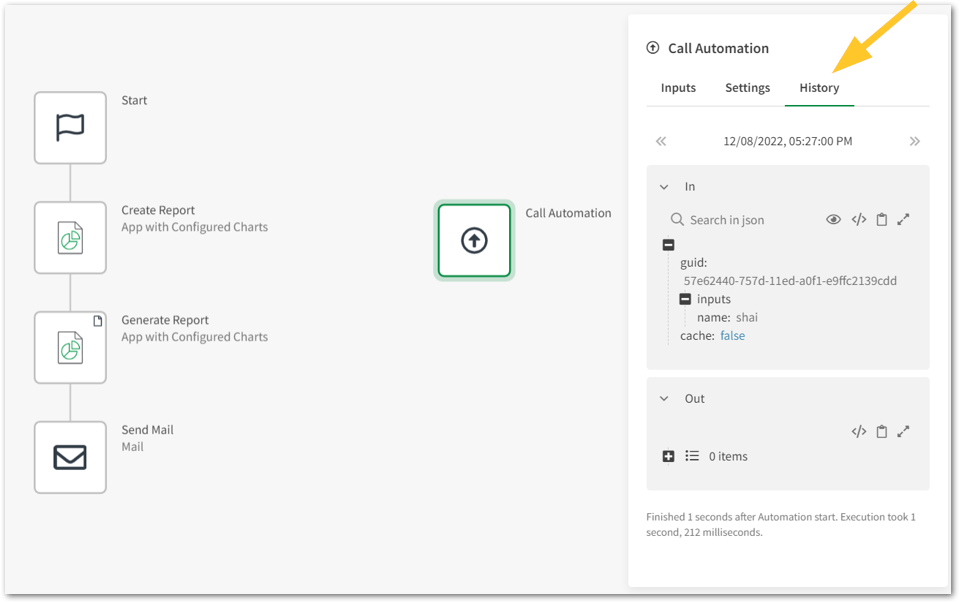
Each block has its own history section. Click the block to view:
- when it has run
- what was in the input
- what was the block's output
This section is useful for:
- Checking what response we get back when running the block.
- Checking the different inputs (settings) we have for that block.
- Finding faulty block settings
- Missing required inputs for the block
- Locating error messages
Export This Run Button in Automations Overview Tab
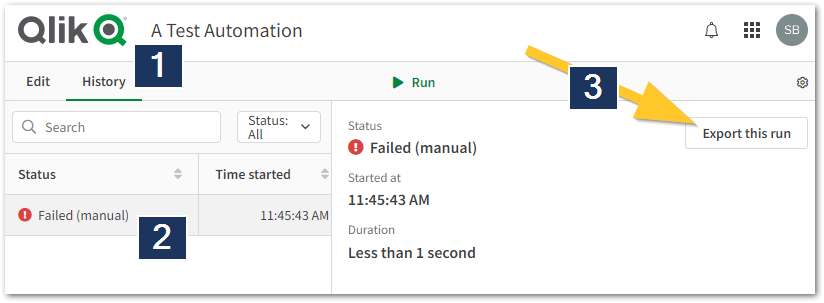
Open your Automation and switch to the History (1) tab in your block. Choose the Run (2) and click Export this run (3).
This generates a JSON object for the automation run itself, which can be read as a programmatic representation of the automation in chronologically view. It includes a JSON object for each execution per block across the entire automation.
It is recommended to send this object to the support team if you require assistance, as we cannot see the overview when importing an automation.
Example JSON of one execution:
{"block":"inputs","index":1,"in_count":1,"timestamp_start":1670513221066783,"timestamp":1670513221066868,"memory_usage":6507256,"out_count":1,"out":{"name":"xxx"},"in":[{"blockid":"inputs","type":"input","options":[],"is_required":true,"prompt":"name","helpText":null}]}
This object can be used to:
- identify inefficiencies in your automation (such as having multiple identical blocks, rather than using a loop)
- get an overview of:
- memory usage
- input and ouput
- start time
- index
- and more
- identify memory bottlenecks
Chronologically Tab in Automations Overview Tab
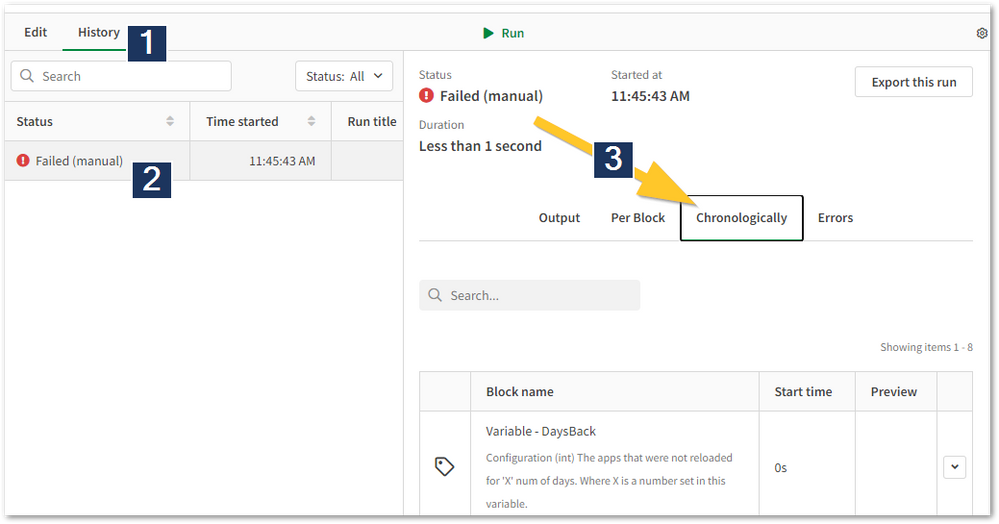
Still in the History (1) tab, switch to the Run (2) you want to view and open Chronologically (3).
This is a UI representation of the order in which the blocks are executing in a specific run. It includes useful details such as:
- input and output of each block,
- start time,
- and a preview of the block's output.
This view can help you understand the flow in which the automation is executed and identify the correct order in which blocks should execute.
Error Tab In Automations Overview Tab
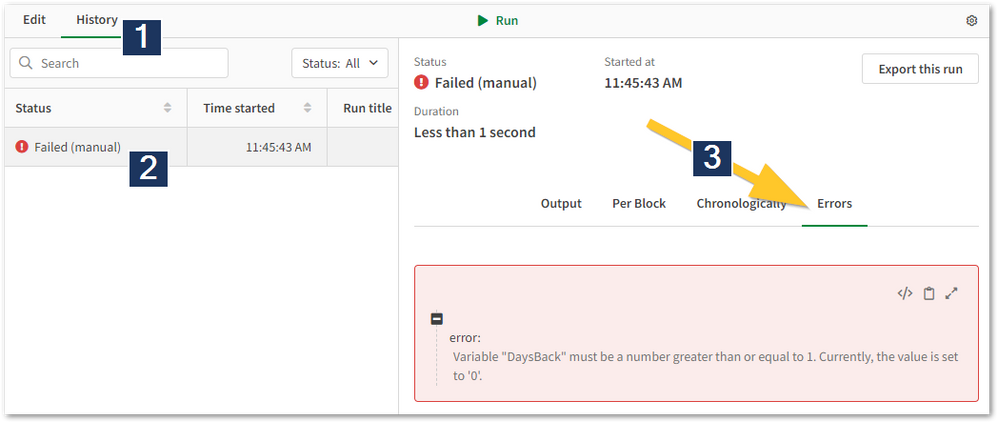
Still in the History (1) tab, switch to the Run (2) you want to view and open Errors (3).
This lists any errors occurring on the selected run.
Per Block Tab in Automations Overview Tab
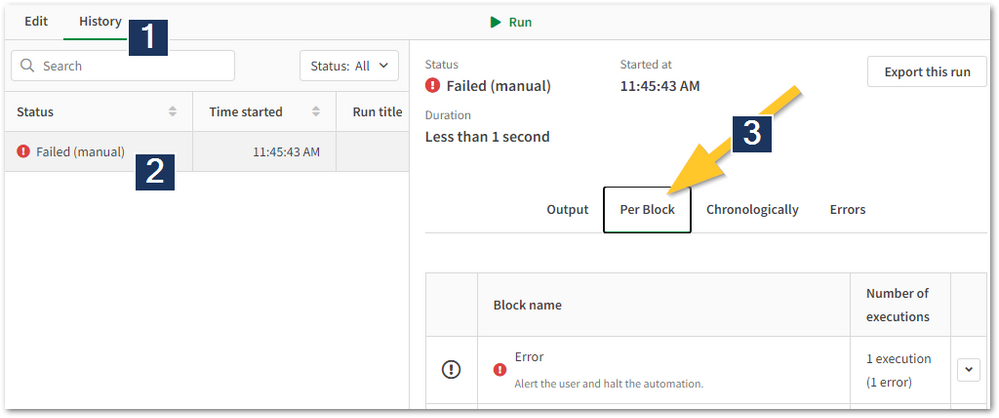
Still in the History (1) tab, switch to the Run (2) you want to view and open Per Block (3).
This is a UI representation of:
- how the blocks were executed,
- the number of times they were executed with no specific order,
- and their input and output.
Show API Endpoint link
Switch to the Editor view (1) and then click on a specific block (2). From there, click Block configuration (3) to expand the configuration menu.
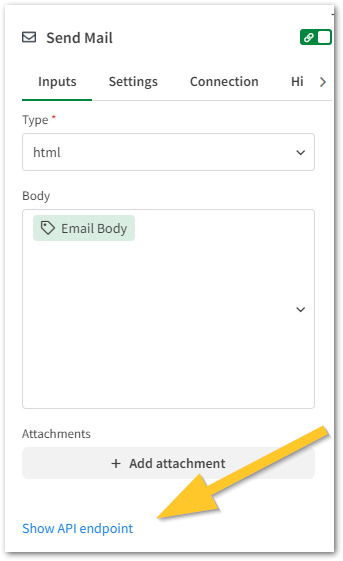
Scroll down and click Show API endpoint.
This reveals the endpoint’s URL and is useful if you wish to run this endpoint outside of Qlik Application Automation, such as from postman, insomnia, curl, etc.
Using this URL you can verify if the third-party API source is the issue or if the endpoint is working as expected.
Locating an Automation ID
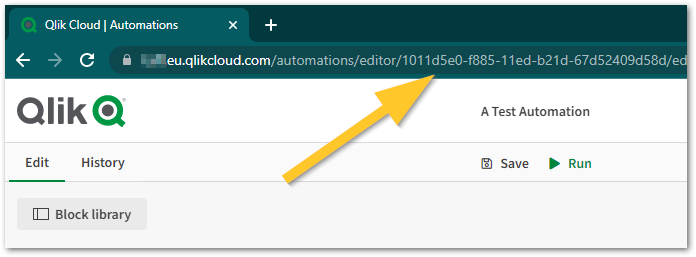
Automation IDs may be needed by Qlik Support to help with further troubleshooting.
Open any automation. The URL will be structured like this: https://xxxxxx.ap.qlikcloud.com/automations/editor/7e45f640-73b4-11ed-9a8a-cbd298af84db
The ID following /automations/editor is your automation ID.
Automation Run ID
Automation run IDs may be needed by Qlik Support to help with further troubleshooting.
Open your Automation and switch to the History (1) tab in your block. Choose the Run (2) and copy the URL from the web browser.
The URL will be structured like this: https://xxxxx.ap.qlikcloud.com/automations/editor/7e45f640-73b4-11ed-9a8a-cbd298af84db/history/c709c840-73b6-11ed-aa48-49e41086f490
The ID following the /history/ section of the URL is the automation run id.
Individual navigation details have changed with a recent Qlik Cloud release. The navigation documented in this article may not reflect your current experience. We are working on updating the article as soon as possible.
Connection Run ID
Connection run IDs may be needed by Qlik Support to help with further troubleshooting as we can identify potential issues using the GUID provided.
This will require the use of your browser's debug tools.
- Go to the Automation menu on the left-hand side in the hub and navigate to the Connections (1) view.
- Open your browser's debug tools and open the Network (2) tab.
- Search for Automation-Connections (3)
- Click on Automation-Connections (4) in the Name tab
- Select Preview (5)
- Locate the Connector by name and expand it. Copy the ID
- Send this ID to support.
