- Subscribe to RSS Feed
- Mark as New
- Mark as Read
- Bookmark
- Subscribe
- Printer Friendly Page
- Report Inappropriate Content
Guided apps are probably the more common data viz pieces nowadays. Are strongly influenced by the traditional journalistic approach to a story and related with storytelling. The goal of guided apps is to walk the reader from point A to point Z.
A well-constructed guided visualization is incredible powerful at proving a point, examples can be found almost daily at mass media websites. As a data professional, I love data stories but maybe because I’m such a data geek I usually never get completely satisfied by the visualizations used to emphasize the story. I almost always hungry for ways to explore the data or I simply miss one angle from the story to feel fulfilled.
On the other hand, the so-called Discovery apps are intended to let the user to manage the ride and rely on reader capacity to be able to interact and to understand the data they are looking at. Scenarios with simple and familiar data are generally more appropriate for discovery apps.
We recently got one of those great data sets for discovery, simple data and containing thousands of potential stories in it. Barcelona Marathon organization contacted us to create a piece to let runners (data users) to explore every corner of their data. They have been collecting runners’ data during the last decade, our part was just to put a nice wrap around it. We like to see it as a nice hybrid (more on the discovery side) of guided and discovery app.
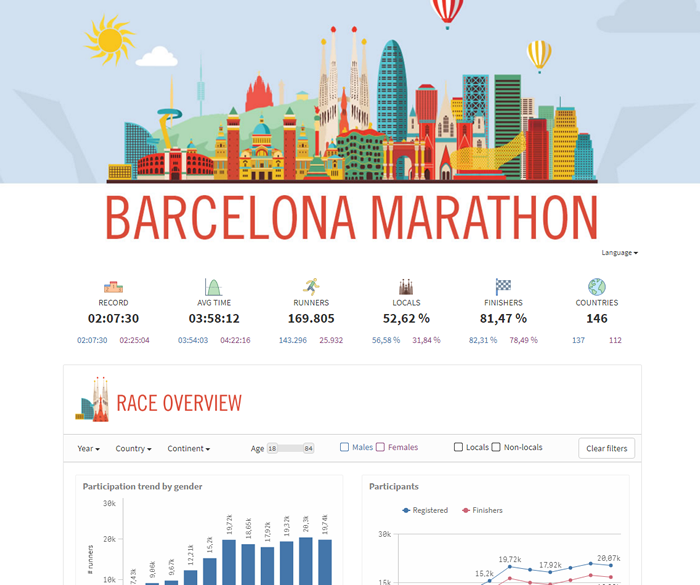
We divided the mashup into three sections trying to help first time users to better get familiarized with the data. It’s just a visual separation of the data, each section belongs to the same data model, filters are global and every selection affect all the charts. For the clarity of it we reduced the use of set analysis as much as possible.
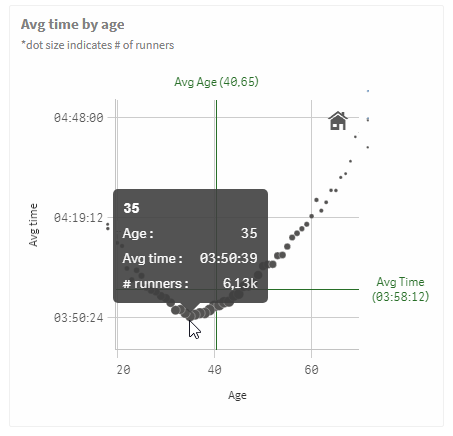
The app starts with race overview data, about participation and finishing times. The second section serves as demographic info, with three main characteristics to consider, age, sex and nationality. Finally, we reserved a little bit of complexity for the very last section, we called it Performance. As you can see in the picture below taken from the chart “Avg time by age” the sweet spot age for someone to run this marathon is 35 years old, in average people in that age get the best results.
You can check the mashup live at Barcelona Marathon page here or as a stand-alone version at Marató Barcelona.
Regards,
Arturo Munoz (@arturoqv)
You must be a registered user to add a comment. If you've already registered, sign in. Otherwise, register and sign in.