Unlock a world of possibilities! Login now and discover the exclusive benefits awaiting you.
- Qlik Community
- :
- Discover
- :
- Blogs
- :
- Product
- :
- Design
- :
- Is there really one type of Ad-hoc Reporting with ...
- Subscribe to RSS Feed
- Mark as New
- Mark as Read
- Bookmark
- Subscribe
- Printer Friendly Page
- Report Inappropriate Content
Hi guys - I hope you enjoy this one. It has been a while since I actually typed-out a blog. I have been so used to recording video for so long, man my fingers hurt! 😩 - Stay well all.
Sample .QVF and .MP4 video attached to this post.
Regards,
Mike
What I want from you
I invite you to share your spin in "Ad-hoc Reporting" as well. I am aware that our valued partners have packaged solutions - so please comment and share your solutions.
What does Ad-hoc mean?
The term "ad-hoc" means "created for a particular purpose" or "when needed". In the analytics world, we have commonly used the the term "ad-hoc reporting" to basically describe the process of easily making your own reports as opposed to consuming standard KPIs in a dashboard or static and operational reports created for you. With the change in BI technology I think it is time to consider new ways and other types of "Ad-hoc" reporting.
Ad-hoc reporting interfaces can vary - and usually provide a means of selecting your tables, fields (dimensions and measures), aggregations, filters etc. They may include ways to combine data and much more. Regardless of the approach and interface it is providing you with answers to your business questions on the fly when needed with the criteria that you are interested in. Here are some new ways of thinking about "ad-hoc" reporting.
The Qlik Sense Design Canvas
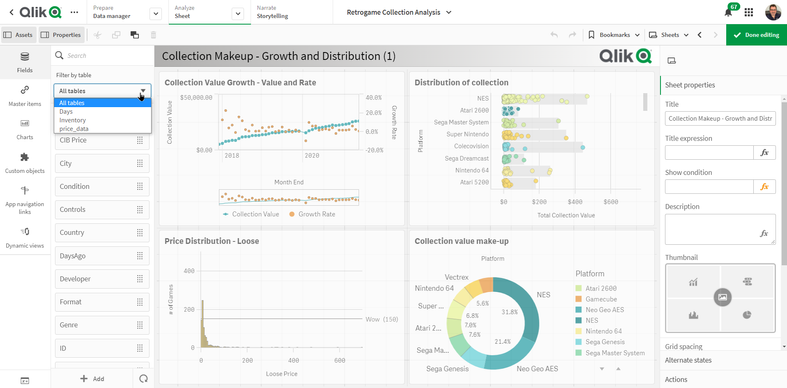
Calling attention to the obvious, out of the box - the Qlik Sense Design canvas - provides all the tools you need to select tables, add measures, dimensions, selections, visual objects etc. So technically could be considered an "Ad-hoc" approach to creating reports and analytics. BUT you can also use this UI to create easy to use "Ad-hoc-like" apps for others to consume. More on this later.
Insight Advisor and the Cognitive Engine
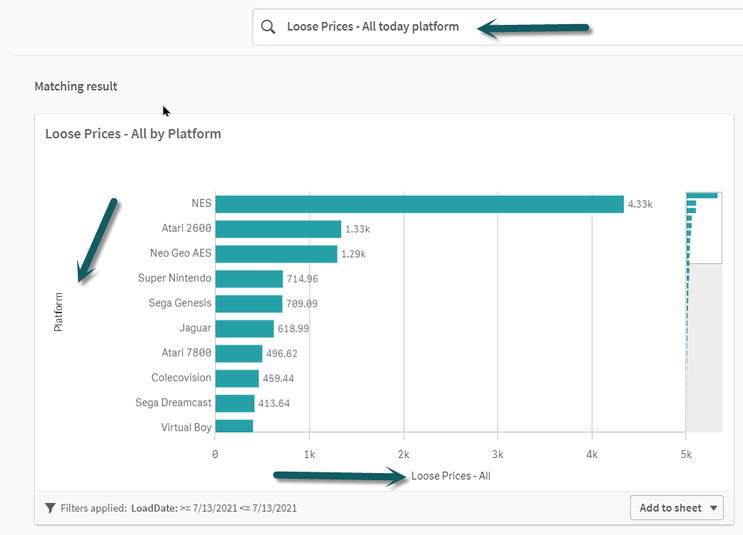
Again, out-of-the-box, Qlik Sense provides an easy to use analytical assistant to answer questions using natural language. Our Insight Advisor Search and Insight Advisor Chat interfaces could be seen as means to create ad-hoc content as you are providing the dimensions, measures and filters in a simple chat or search UI and the Qlik Cognitive Engine produces or suggests results to answer your question, that you can then easily review or add to your design canvas for analysis. It is important to note that when analyzing data , at any time you can use Insight Advisor search to further your exploration and discovery - it IS NOT just an easy way to create charts to be added to your design canvas for your dashboard.
Alternative Dimension and Measures feature
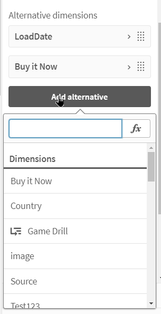
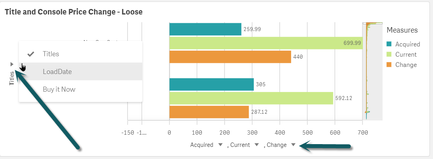
There may be a time when you want more control on what is displayed in the chart or table, without having to create multiple copies of the object with different fields, aggregations and properties. This can be done easily with the Alternative Dimensions and Measures feature available in the data tab of the chart object. BUT - with this feature you are predefining the chart object to use a set list of dimensions and measures. It requires the used to open the Exploration menu in the chart to change the fields - or they can use the arrows on the legend.
Creating Custom Qlik Sense "Ad-hoc" apps
Other approaches to "Ad-hoc" with Qlik Sense involve creating custom Qlik Sense apps (or web-based mashups) that have selection interfaces that drive dynamic "report templates". These report templates are pre-defined with expressions , master items, variables etc. These expressions and/or variables are substituted with dimension and measure fieldname values provided by the selectors. A chart object (table, graph) uses placeholders variables or fieldnames that will change on the fly based off the selected value. Therefore creating a purely dynamic chart from the user's input.
Our Tomi Komolafe has contributed a great video showing us one of his examples of how he built a simple Ad-hoc reporting app for a customer. Check it out below! f you are a YouTube user, I suggest you subscribe to his channel to see what other great Qlik tips and techniques he has to offer. Thanks for your valuable contributions Tomi!
For other examples of working with your own ad-hoc interfaces - check out my Do More with Qlik session on Fun with variables.
You must be a registered user to add a comment. If you've already registered, sign in. Otherwise, register and sign in.


