Unlock a world of possibilities! Login now and discover the exclusive benefits awaiting you.
- Qlik Community
- :
- Blogs
- :
- Technical
- :
- Design
- :
- Relative Calendar Fields
- Subscribe to RSS Feed
- Mark as New
- Mark as Read
- Bookmark
- Subscribe
- Printer Friendly Page
- Report Inappropriate Content
A common question in the QlikCommunity forum is how to show only the last N months. The suggested answers are most of the time relatively complex set analysis expressions including dollar expansions with aggregation functions, e.g.
Sum( {$<Date={">=$(=MonthStart(AddMonths(Max(Date),-12)))<$(=MonthEnd(Max(Date)))"}>} Sales)
Such an expression may work fine. However, it is not simple. When seen by someone who didn't write it, it is almost incomprehensible. So instead of such an expression, I would like to suggest a slightly different method: Relative calendar fields.
The idea is to define relative calendar fields in the master calendar. By doing this, it will be a lot simpler to define chart expressions. For example, you can in your master calendar define fields calculating how many days or months ago a specific date was:
Today() - Date as DaysAgo,
12*(Year(Today())-Year(Date)) + Month(Today()) - Month(Date) as MonthsAgo,
Then you will be able to have much simpler chart expressions, e.g:
Sum({$<MonthsAgo={">=0<12"}>} Sales)
This expression does almost the same as the initial expression. But it is much easier to read and understand. Below you have a chart using this expression showing the last 12 months. (Financial year that starts in April; today is a day in June and the dimensions are rolling month [Date(MonthStart(Date),'MMM')] and fiscal year.)

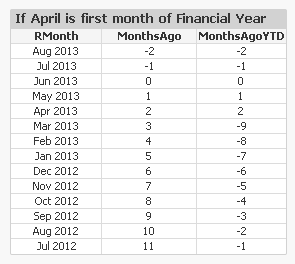
Further, you can also create fields for relative months within the financial year; fields that you can use for a year-on-year comparison:
Today() - YearStart(Today(),0,$(vFM)) - Date + YearStart(Date,0,$(vFM)) as DaysAgoYTD,
Mod(Month(Today())-$(vFM),12) - Mod(Month(Date)-$(vFM),12) as MonthsAgoYTD,
The variable vFM is the first month of the financial year, see more on Fiscal Year.
If you have these fields defined, you can easily make a year-to-date chart comparing the different years. The expression will be the same as before, but with MonthsAgo changed to MonthsAgoYTD:
Sum({$<MonthsAgoYTD={">=0"}>} Sales)
Below you have a chart of a year-over-year comparison (using the built-in accumulation):
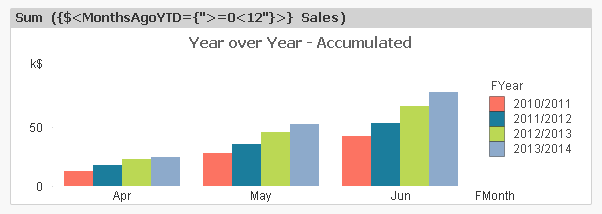
Bottom line: By defining relative dates and months in your master calendar, you can significantly simplify your set analysis expressions. Also, such fields will help your users create new charts. And your charts may even evaluate faster...
Simplicity.
- « Previous
-
- 1
- 2
- 3
- Next »
You must be a registered user to add a comment. If you've already registered, sign in. Otherwise, register and sign in.