Unlock a world of possibilities! Login now and discover the exclusive benefits awaiting you.
- Qlik Community
- :
- Discover
- :
- Programs
- :
- Education
- :
- Qlik Education Documents
- :
- Obtaining Memory Statistics for a QlikView Documen...
- Subscribe to RSS Feed
- Mark as New
- Mark as Read
- Bookmark
- Subscribe
- Printer Friendly Page
- Report Inappropriate Content
Obtaining Memory Statistics for a QlikView Document
- Mark as New
- Bookmark
- Subscribe
- Mute
- Subscribe to RSS Feed
- Permalink
- Report Inappropriate Content
Obtaining Memory Statistics for a QlikView Document
Aug 15, 2014 3:28:53 PM
Aug 15, 2014 3:28:53 PM
If you are experiencing slow performance in a specific QlikView document, QlikView Optimizer can help you.
You can investigate which object is consuming the most memory within the document, and if it is significantly higher compared to others, then you may consider removing the object, avoid complex expressions or modifying data model.
Also, you can specify an estimate number of users to foresee how much RAM you may need for expansion of QlikView environment.
A .mem (memory statistic) file can be generated by QlikView files if specified. Make sure to interact with objects (open minimized objects, make selections etc) before a .mem file is saved. You can save a .mem file in
Settings >> Document Properties >> General Tab >> Memory Statistics...
The memory statistic file allows you to capture the behaviors of each QlikView document. QlikView Optimizer can read more than one mem file so that you can compare multiple QlikView document behaviors. And from the result, you may modify your QlikView documents for better performance!
QlikView Optimizer lets you monitor Bytes, Count, Size, CalcTime, AvgCalcTime etc.
Take a close look at "bytes" column in Actual Usage tab to find out which object or field is costing the most memory.
* Once the file paths are specified, go to File >> Reload to read your files.
- Mark as Read
- Mark as New
- Bookmark
- Permalink
- Report Inappropriate Content
Hello, may I ask you, if the sum of Bytes column values in .mem file shows how much memory is this document consuming total?
- Mark as Read
- Mark as New
- Bookmark
- Permalink
- Report Inappropriate Content

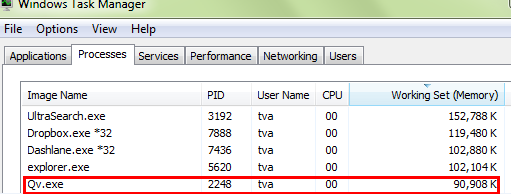
 If you are interested in finding out how much memory the document is consuming in total, open QlikView Desktop, and before you open the document in question, take note of how much memory Qv.exe is consuming:
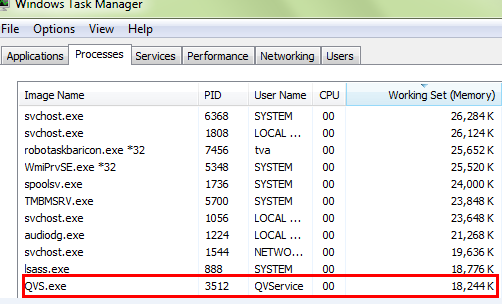
Now open the document in question, and notice how much memory Qv.exe is consuming
Qv.exe will further adjust its memory requirements with every selection you make.
For example, I selected an Investment Profile in Asset Management, and the memory required by Qv.exe changed to

The memory requirements are changing to meet the “selection” needs of the user.
Hope this helps,
Tony
- Mark as Read
- Mark as New
- Bookmark
- Permalink
- Report Inappropriate Content
Thank you, but is there some better way than manual one? We need to report ram and cpu consumption of each document on QV server separatelly and I've been looking for some solution for month, but there's only whole server consumption in each log file I had found. I hoped these .mem files could help ![]()
- Mark as Read
- Mark as New
- Bookmark
- Permalink
- Report Inappropriate Content
marosmolek<http://community.qlik.com/people/marosmolek?et=watches.email.document_comment>,
I would suggest taking a look at the monitoring links:
Monitoring Links
Troubleshooting QlikView Server with the System Monitor 01/14 (Video demonstrating System Operations Monitor)
http://community.qlik.com/docs/DOC-5705
QlikView Governance Dashboard
http://market.qlik.com/qlikview-governance-dashboard.html
New utility to monitor QlikView Server usage
http://community.qlik.com/thread/102170
QlikView Application: System Monitor v5.1.20
http://community.qlik.com/docs/DOC-4307
Power Tools 1.2 for QlikView released
http://community.qlik.com/message/473262#473262
Tony
- Mark as Read
- Mark as New
- Bookmark
- Permalink
- Report Inappropriate Content
Thanks for a nice solution, I did find where is the maximum memory consumption. I my application its the database which I cant change coz they need all that information. The next big one is in the straight table which I cant change. So any idea what else can I do to reduce the memory consumption. My application size is 30MB and the memory consumption is as follows. Any help here would be greatly appreciated.
Thanks
- Mark as Read
- Mark as New
- Bookmark
- Permalink
- Report Inappropriate Content
You stated that you are unable to change your database and your straight table. If you are incorporating Table Boxes, with a large amount of records, that could contribute an increased memory consumption
- Mark as Read
- Mark as New
- Bookmark
- Permalink
- Report Inappropriate Content
Thanks for your reply, but I am not using any table boxes, I used Document Analyzer By Rob Wunderlich (Downloads - Rob Wunderlich Qlikview Consulting) and found that my StraightTables and Pivot tables which have more than 70k records are the ones using more bytes. There are total of 36 straight tables :-S 18 allow the user to enter the information in inputfields and other 18 capture those values which I then export to excel. I am failing to understand as to what should I do to minimize the memory usage. 😞
- Mark as Read
- Mark as New
- Bookmark
- Permalink
- Report Inappropriate Content
Memory usage would also be related the size of the data set that the chart is calculating over. Have you considered reducing the number of rows during the extraction process by using a Where or other type of clause that sets a condition on the number of rows being extracted?
Lastly, if the memory usage issue is a critical problem, I would suggest contacting Qlik Support in order to get an immediate resolution to your issue.