Unlock a world of possibilities! Login now and discover the exclusive benefits awaiting you.
Documents related to Qlik Education.
Recent Documents
-

-
-
Extension. Prevent multiple response from GetQvObject method
Hello, Everyone!This material will show how to avoid strange issue of qva.GetQvObject method.The issue is response from this method's callback is repe... Show MoreHello, Everyone!
This material will show how to avoid strange issue of qva.GetQvObject method.
The issue is response from this method's callback is repeated multiple times.
Honestly I don't know why it's happening, but I know how to struggle with it.
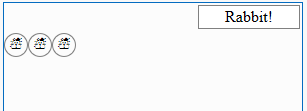
Let's take a look at simple instance. We have an extension that should create a rabbit each time we press the button "Rabbit!".
After three hits we want to get something like this:
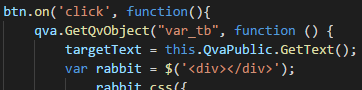
We use qva.GetQvObject method for getting a value from TextBox text with "var_tb" ID:
If we don't use special preventing condition our result after three hits will be:
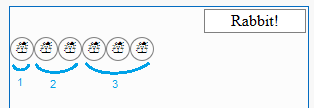
This is definitely not what we want. After few more clicks we will have a plenty of rabbits.
All you need to do is to add an extra IF-condition which will prevent of using callback function if true:
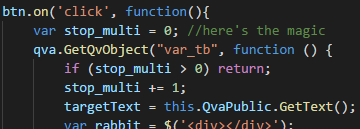
That's all. "stop_multi" will be increased each time method is passed so when we get value of it greater that zero callback will be prevented.
Hope it will help you with improved development 😃
-
Direct Discovery in Qlikview
Direct Discovery in QLIKVIEW 11.2The biggest limitation of QLIKVIEW in data point of view, is that all the data should be stored in RAM. As big data i... Show MoreDirect Discovery in QLIKVIEW 11.2
The biggest limitation of QLIKVIEW in data point of view, is that all the data should be stored in RAM. As big data introduction data is too huge, so QLIKVIEW introduce a hybrid approach. In which QLIKVIEW stores the dimension in the RAM, while measures or the numeric values are stored in the database you want.
Basically aggregation of measures are run on the database not in memory, which reduce the RAM usage. It will be used when our database speed is good enough.
QLIKVIEW introduce the new type of query for these kind of requirement “Direct Query”.
It has three types of field
1) Dimension:- which are used for association
2) Measure: - on which we perform the aggregation
3) Detail:- those field which can’t be used for association or aggregation. Like Comments.
The script look like below
DIRECT QUERY
DIMENSIONDIMENSION-1,
DIMENSION-2,
:
:
:
DIMENSION-n
MEASURE
MEASURE-1,
MEASURE-2,
:
:
:
MEASURE-n
DETAIL
DETAIL-1,
DETAIL-2,
DETAIL-3
FROM TABLE;The unique values of Dimension will be fetched in the QVW, and that can be used for creating association between data and other data.
Example:
ODBC CONNECT32 TO [Tutorial;DBQ=D:\Database\TUTORIAL_DATA_7200.mdb];
[DirectDiscovery]:
DIRECT QUERY
dimension
CALL_CTR_ID,
CUST_CITY_ID
detail
COMMENT
measure
GROSS_DOLLAR_SALES
FROM CITY_CTR_SLS;
When we run the script it will result in the following script:
You can see in the CALL_CTR_ID- only 15 values are fetched. And in CUST_CITY_ID 436 lines are fetched. Measures are not stored in QVW.
We can check the Tracing of ODBC connection in ODBC.
And can see your file in this location
C:\Users\user12\AppData\Local\Temp\SQL.txt
Because of the interactive and SQL syntax-specific nature of Direct Discovery, several QLIKKVIEW features are NOT supported:
- Advanced calculations (Set Analysis, complex expressions)
- Calculated dimensions
- Comparative Analysis (Alternate State) on the QlikView objects that use Direct Discovery fields
- Direct Discovery MEASURE and DETAIL fields are not supported on Global Search
- Binary load from a QlikView application with a Direct Discovery table
- Loop and Reduce
- Synthetic keys on the Direct Discovery table
- Table naming in script does not apply to the Direct table
- The use of wild card * character after DIRECT QUERY keyword on the load script (DIRECT QUERY *)
- Oracle database tables with LONG data type
- columns are not supported.
- Big integers in scientific notation, outside range [-9007199254740990, 9007199254740991], can cause rounding errors and undefined behavior.
QLIKVIEW Direct Discovery can be used against the following data sources, both with 32-bit and 64-bit connections;
- ODBC/OLEDB data sources - All ODBC/OLEDB sources are supported, including SQL Server, Teradata and Oracle.
- Custom connectors which support SQL – SAP SQL Connector, Custom QVX connectors for SQL compliant data stores.
-
Catch the Clear Button Hit
Do the followin' if you want to catch User's hit on Clear button.Also can be usefull with many trigger actions.Steps:1. Create a variable vClearButton... Show MoreDo the followin' if you want to catch User's hit on Clear button.
Also can be usefull with many trigger actions.
Steps:
1. Create a variable vClearButtonHit;
2. Set this expression for it:
=if($(vClearButtonHit)-isnull(GetCurrentSelections())>10,0,$(vClearButtonHit)-isnull(GetCurrentSelections()));
[this condition will increase variable value till it under 10, after that the value will be droped to zero]
3. Make a trigger on changing this variable (Ctrl + Alt + D -> Triggers).
In attached example trigger is set for selecting 'x' value in f3 field on Clear Button hit.
Sometimes it can be usefull and it's an analogue of "One Selected Value" option.
-
Qlik Training Session - Joins, Keeps, Apply Map.qvw
This QlikView Document will help you to understand QlikView Joins, Keeps, Concatenate and Applymap functions with examples and scripts. This is a Nice... Show MoreThis QlikView Document will help you to understand QlikView Joins, Keeps, Concatenate and Applymap functions with examples and scripts. This is a Nice QlikView Training application to perform a QlikView Training by using a QlikView application itself.

-
Visual tricks with Charts. Drop Graph
Hello, Everyone!Today we gonna create this little fella:Looks pretty cool and unusual. Let's get started!For instance we have such input data:Step 1. ... Show MoreHello, Everyone!
Today we gonna create this little fella:
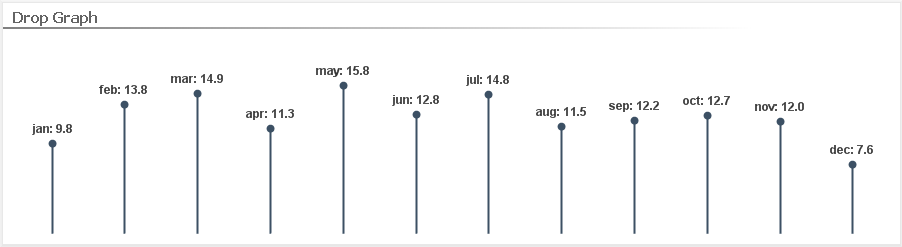
Looks pretty cool and unusual. Let's get started!
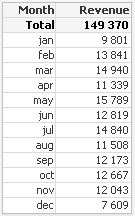
For instance we have such input data:
Step 1. Convert months text values to numbers and add rows with value equal 0.00001:
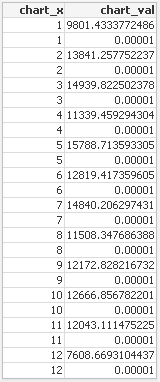
Where "chart_x" it's our months converted to numbers, "chart_val" - it's Revenue with additional 0.00001 value.
Step 2. Create a Line Chart:
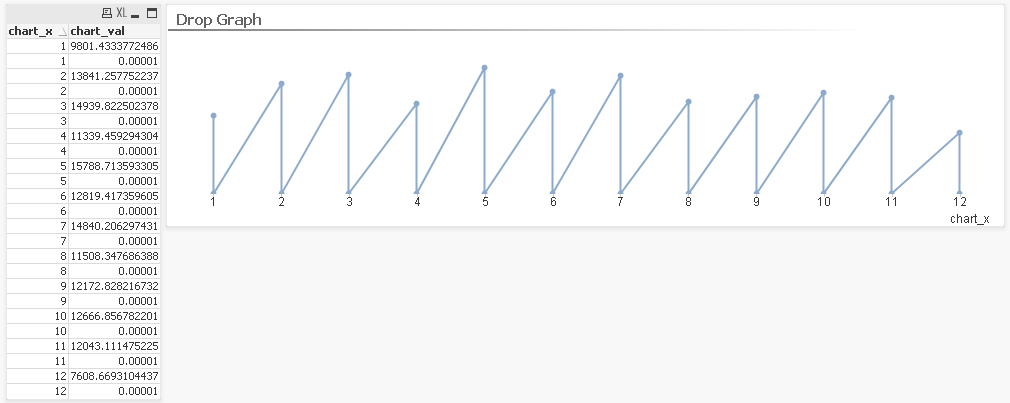
Note: You should turn on "Continuous" option in Dimension Axis zone at the Axes tab.
Step 3. Go to the Background Color option of the expression and use this condition to color our lines:
if(Frac(chart_x)>0,ARGB(0,0,0,0))
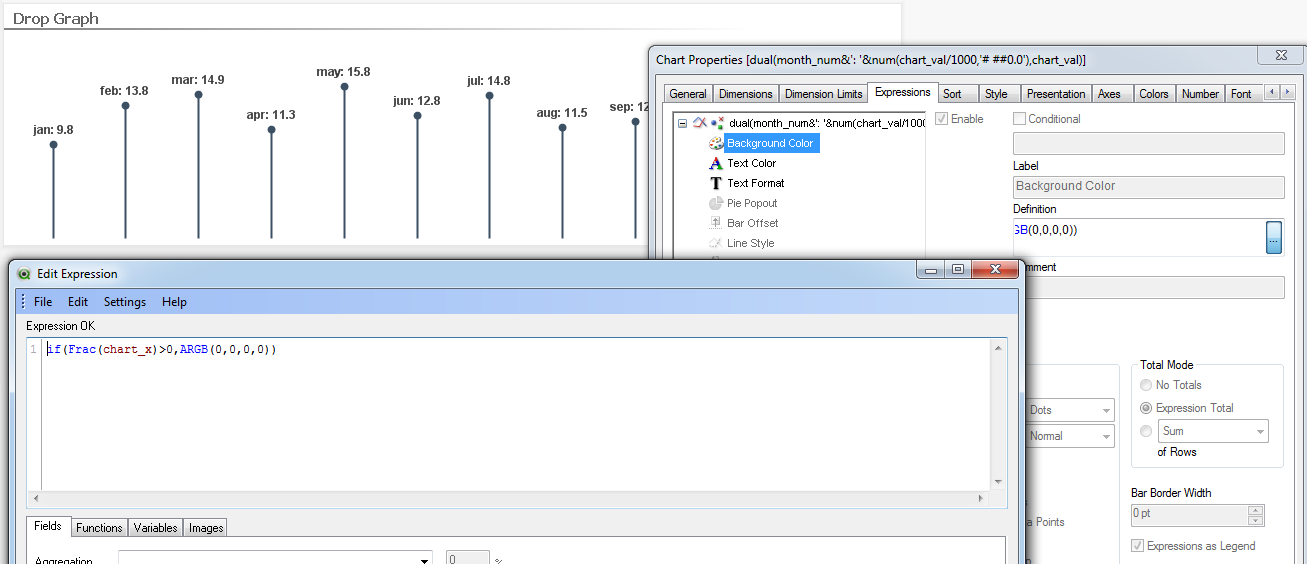
That's all!
I'd also made some cosmetical things to make it looks prettier. You can find them at the attachement.
Hope you like it and if it's so - please, share your opinion and rate this document. Thanks!
-
How to create a vertical chart in a Straight Table
Hi, Everyone!Today I'm gonna tell you one of the QV mysteries - creating a vertical chart with less/more bars in a straight table.So, if you are inter... Show MoreHi, Everyone!
Today I'm gonna tell you one of the QV mysteries - creating a vertical chart with less/more bars in a straight table.
So, if you are interesting with something like this:
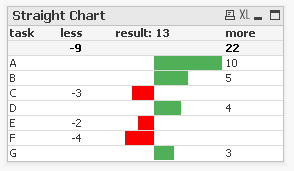
Please, make an effort to read the text below.
For instance you have a data:
LOAD * Inline
[task,val
A,10
B,5
C,-3
D,4
E,-2
F,-4
G,3];
1. Load it and create a Straight Table with Task dimension;
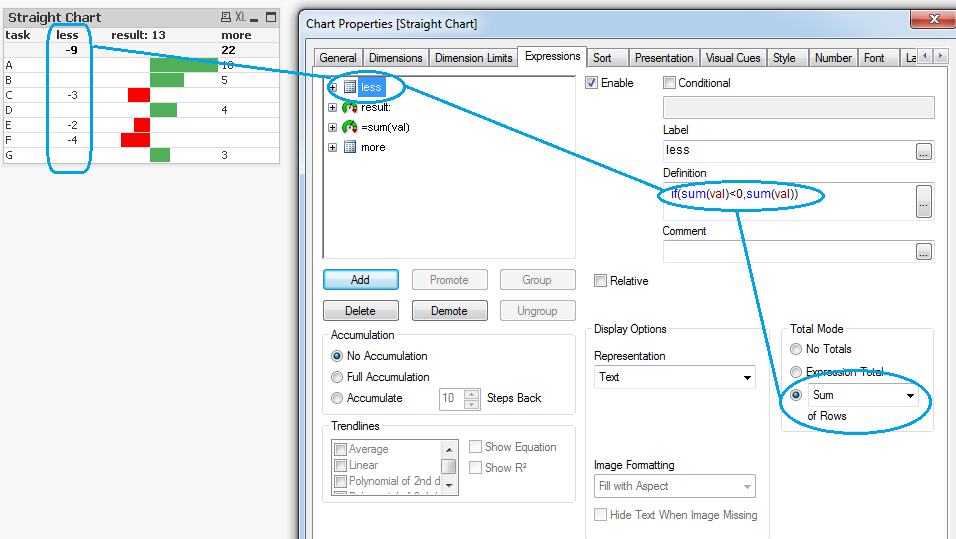
2. Create an expressions "less" and "more" which will sum negative and positive values of Val field. Use the Sum of Rows in Total Mode to show a partial sum:
3. Create one more expression and change the display option from "Text" to "Linear Gauge" and set the parameters of it:
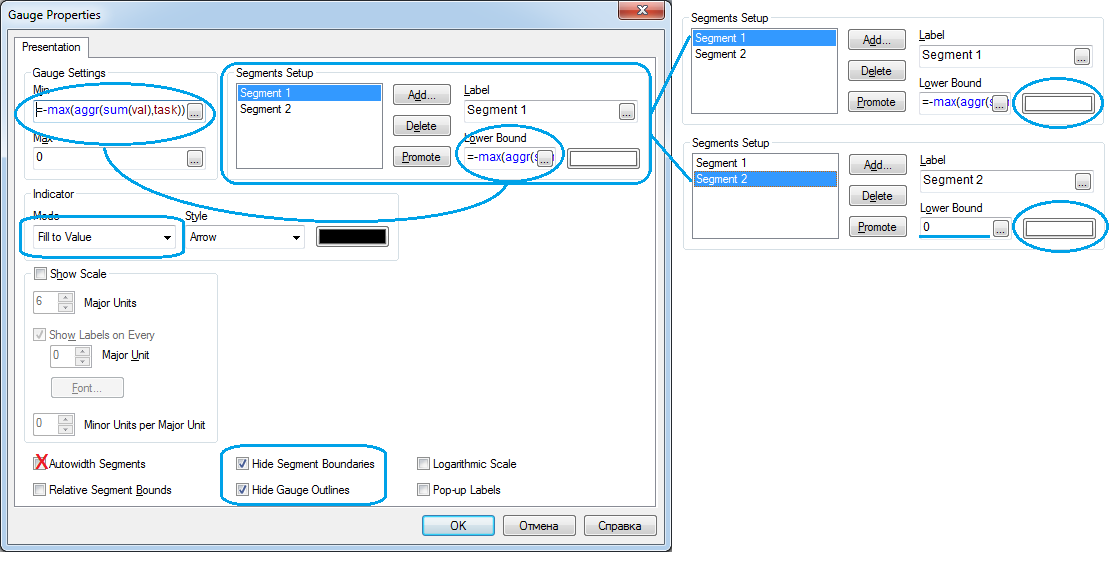
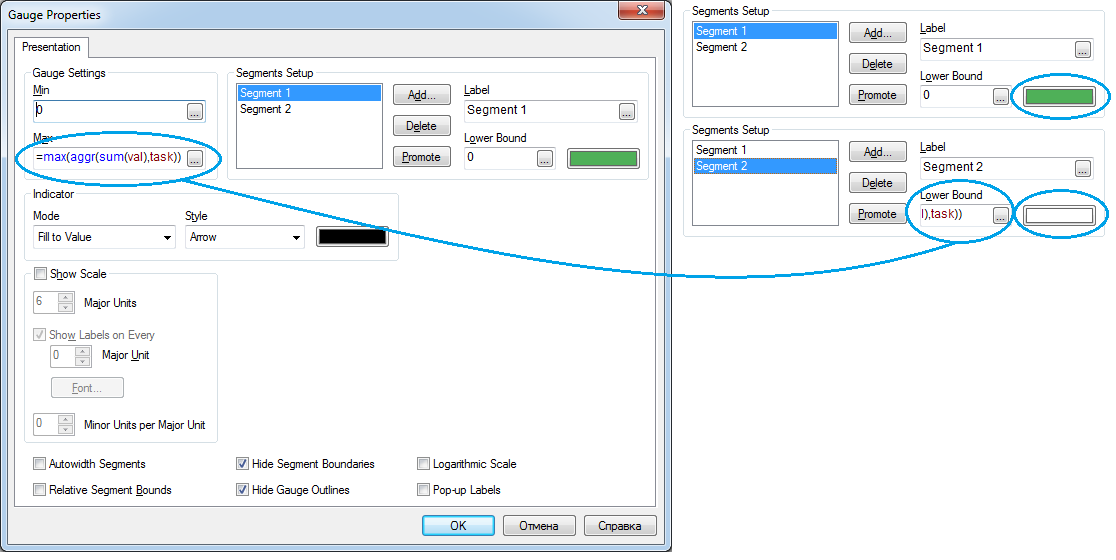
So, you need to create two segments with white color and set an expression of minimum value in Min Value and Lower Bound of the first segment. Switch off the Autowidth Segments. Hide boundaries and outlines.
4. Now, here is a magic. We will create a red bars not with a segment setup but with a background of cells of our new expression.
Go to the new expression and find a background color option. Set an expression which will color our cells in red if they are under the zero.
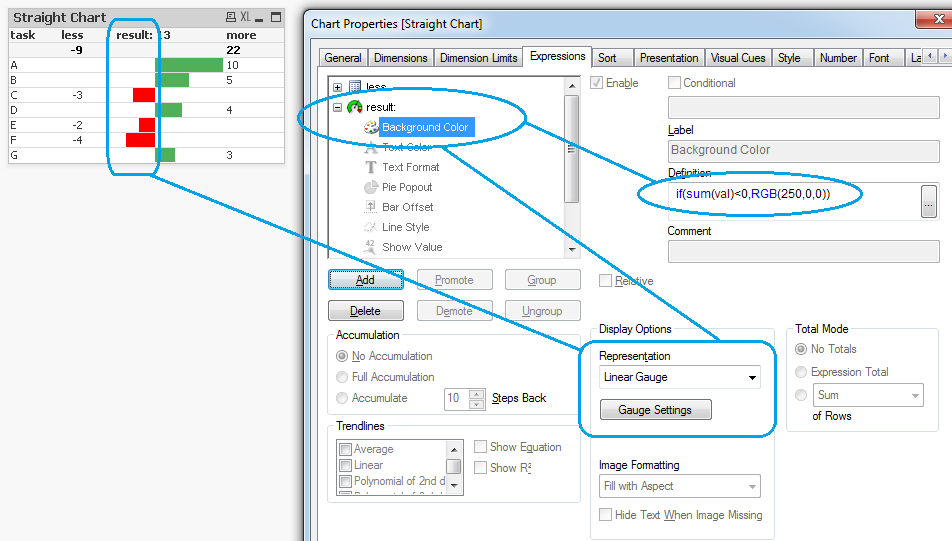
The picture above is for paragraphs 3 and 4.
If you did it right you will see a red background overlapped with white segment. Red bars completed.
5. Green bars are easier, there is no need of background color. It will be enough to create two segments from 0 to max and set a correct colors:
Note: Red bars and Green bars are two separated expressions with adjacent zero line.
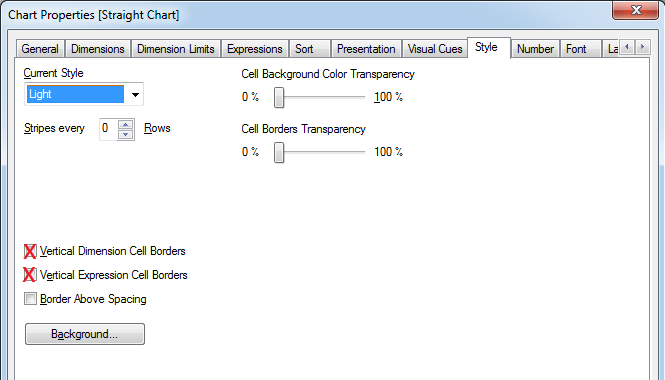
6. The last one is to hide borders and make some cosmetical things:
That's it. Straight-Vertical-Chart is completed. Yes, there is a little defect when your negative value will be the last of the table (red thin background line will be visible through cell). But it shouldn't make a big sense.
Hope you'll find it usefull and may be it will save your time!
If you like the post - please rate it or leave a comment!
Thank you!
-
Visual tricks with Charts
Hi, everyone!Today I want to share with you with some tricks which you may use to improve your projects/dashboards from visual side.The main idea of t... Show MoreHi, everyone!
Today I want to share with you with some tricks which you may use to improve your projects/dashboards from visual side.
The main idea of this post is using a function RangeSum() to achieve a different results which can be used to define a colors in your charts.
In the attached file you will find a four charts with different results of the same thing:
The first one gives an answer for the question "Is the next bar is bigger than previous or not?"
The second shows a dynamic and mark plot values with symbols ▲/▼ (alt+30, alt+31).
The third shows a number of bars that bigger than average among all values.
And the last one tells a user how good or bad a business are going. It accumulate a difference between adjacent bars and at the end we can see a total difference. If it's uder the zero the plot area will be red, else - green.
Also, you can be interested with the 2nd chart because it's a combined of two similar charts, but with the different visualization.
Note: often use of function rangesum() may reduce a performance of your project! Don't get carried away 😃
Also you can find how to use a refference lines.
I will be pleased if this material will help you even a little!
-
Segmentation of values with irregular ranges
I was thinking about how to segment the employees of the company according to their age and I found the "Class" function. It is very interesting and v... Show MoreI was thinking about how to segment the employees of the company according to their age and I found the "Class" function. It is very interesting and very comfortable when the intervals are regular, 5 in 5 or 10 in 10, for example. But when the intervals are different from each other, it does not work well for us.
I think a good solution, which seems to work correctly and is very flexible, is to use the "IntervalMatch" function. It behaves similarly to the Excel Vlookup function.
The magic is in this function that manages to make a relation based on the definition of the intervals.
//Load Employees
employees:
Load * Inline [
Name, Age
Nieves, 21
Enrique, 48
Alberto, 22
Sergio, 23
Pedro, 23
Fran, 18
Víctor, 47
Cervanes, 64
];
// Load intervals or ranges
ageSegmentation:
Load * Inline [
Start, End, Group
18, 20, Young
21, 25, AlmostYoung
26,49, Adult
50,150, Senior
];
// The magic is in this function that manages to make a relation based on the definition of the intervals.
Inner Join IntervalMatch (Age)
Load Start, End
Resident ageSegmentation
I hope this is useful for you
-
Comments, Tags, and Documentation
Under Document Properties there is a Tables page that offers functionality surrounding QlikView metadata. The attached document explains how to use so... Show MoreUnder Document Properties there is a Tables page that offers functionality surrounding QlikView metadata. The attached document explains how to use some of the functions on that page such as Comments and Field Tags. We will see where QlikView displays this information. As Developers, we all relish writing documentation.......sure. Thankfully, some elements in QlikView will allow you to get a jump start in creating documentation that you should maintain for your QlikView application.

-
Qlikview reading firebird database.docx
Qlikview reading firebird databases
-
Qlikview adhoc dimension analisys [My own example]
Hi everybody,I've been demanded recently customizable reports in Qlikview 11 and a way to accomplish this requirement was to let the users explore and... Show MoreHi everybody,
I've been demanded recently customizable reports in Qlikview 11 and a way to accomplish this requirement was to let the users explore and design their own reports by adding or hiding columns and expressions.
I just wanted to share with everybody a simple example in which by loading inle sample dummy data we can create an small testing table and a chart which is using this Qlikview feature. Let's review it step by step :
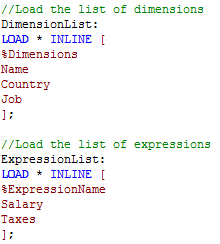
1. Create an inline sample table with 3 or 4 dimensions and a couple of expressions:
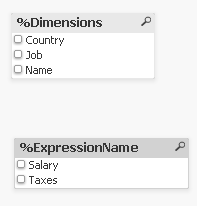
2. Let's create now 2 data island in our model, those with contain all dimension names and expression names each data island.
3. Now we have all the data model built in our QVW. The idea here is to create a straight table containig the dimensions and expressions of the Data table and let the user select which ones will be displayed. Once we have the table created with our dimensions and our expressions we will need to put the following conditions:
Alt( WildMatch ( GetFieldSelections(%Dimensions,'|'), '*DIMENSION_NAME*' ), 0 )
Alt( WildMatch ( GetFieldSelections(%Dimensions,'|'), '*EXPRESSION_NAME*' ), 0 )
Then we can create 2 selectors, one for the dimensions and another one for the expressions using our data islands:
Now, whenever the user clicks on any checkbox the report will be constructed dinamically by using the conditional expressions which will search the dimension/expression name.
-
How to make Qlikview a real time system Update DB and Qlikview Online
Qlikview is E-TL offline (Transform, Load) tool like every standard BI tool, but with a lot flexible features that can make the using as you wish. ... Show MoreQlikview is E-TL offline (Transform, Load) tool like every standard BI tool, but with a lot flexible features that can make the using as you wish.
First, let’s talk about limitation.
QVW file include all the information: Data and design setting, actually It’s a “finished product”.
we can use Binary function, control and reorganized the data in the “Transform” and “Load” part.
When we finished all the process and arrived to the last part we can’t make any changes and probably not online
Up to version 11 the dynamic update feature get in
Dynamic update its feature that give as make query on virtual data model that floating on memory and show changes imminently
So what will upend after the reloading? all the changes will reset, the database not yet update.
To solve this issue that give us real time system we most to use integration of two component.
1) Vbscript for SQL query to the Data Base. (Data Base Update)
2) Dynamic Update query to the qvw model. (Qlikview Update)
Dynamic update setting
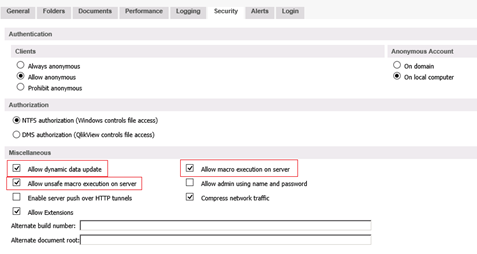
1) Server setting:
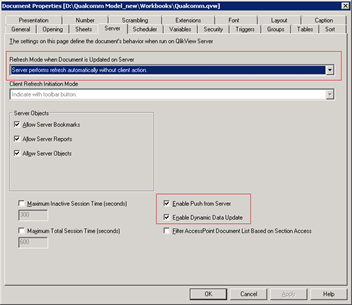
2) Qvw setting:
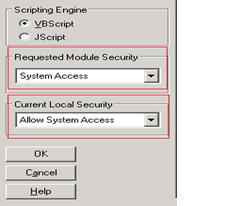
3) Vbscript editor setting:
4) VBSCRIPT MACRO LOOP UPDATE FROM TEMP TABLE:
sub UpdateFromTB4UP
Rem ***set 3 variable for every field in Temp Table****
V1 = 0
V2 = 0
V3 = 0
Rem ****SET ODBC CONNECTION SETTING***
set conn = createobject("adodb.connection")
Set objRecordSet = CreateObject("ADODB.Recordset")
conn.open "dsn=DB_QV;uid=;password=;"
Rem ****Get Table From SheetDocument****
set TableBox = ActiveDocument.GetSheetObject("TB4UP")
CellRect = ActiveDocument.GetApplication().GetEmptyRect()
CellRect.Top = 0
CellRect.Left = 0
CellRect.Width = TableBox.GetColumnCount
CellRect.Height = TableBox.GetRowCount
set CellMatrix = TableBox.GetCells( CellRect )
Rem ****Loop for Insert 3 variable for every Line*****
for RowIter=CellRect.Top+1 to CellRect.Height-1
V1 = (CellMatrix(RowIter)(0)).Text
V2 = (CellMatrix(RowIter)(1)).Text
V3 = (CellMatrix(RowIter)(2)).Text
SQL_String="UPDATE * SET FIELD1 = '1' WHERE FIELD2 = "&V1&";"Rem **** Run Data Base server Query
objRecordSet.Open "UPDATE TABLE1 SET FIELD1 ='1' WHERE FIELD2 ="&V1&";",conn
Rem **** Run Dynamic Update
SET Result = ActiveDocument.DynamicUpdateCommand (SQL_String)
nextRem *** clear temp table
SET Result1 = ActiveDocument.DynamicUpdateCommand ("DELETE FROM UPDATE_DEBUG WHERE -1")
end sub
Shneior Dicastro
-
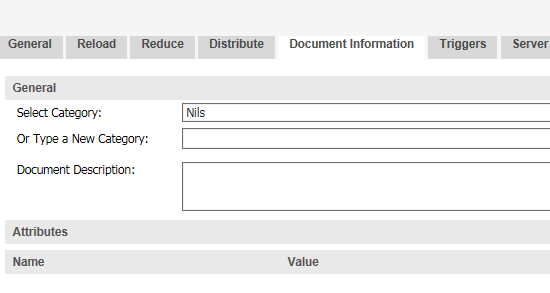
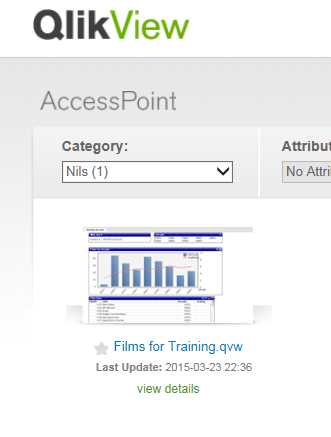
Renaming the Document Information category in QlikView Publisher
When running Server Publisher classes I often get the question if it is possible to edit a task or document category name or even remove a category n... Show MoreWhen running Server Publisher classes I often get the question if it is possible to edit a task or document category name or even remove a category name once this has been created.
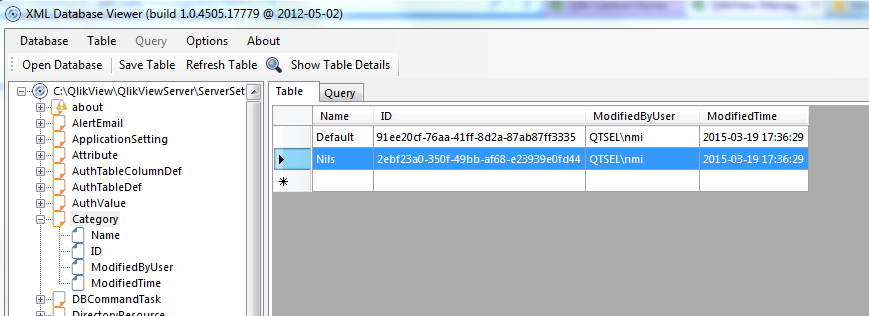
As far as I know this is not possible to do from within the actual QMC however this is possible if you edit the name directly in the QVPR. I am always cautious when touching the QVPR and always make sure I have backed this up before actually making any changes (just look for the Repository tab under Systems > Setup > Management Service and press the Backup button at the bottom of the page). To edit the actual QVPR (XML tables) I use the Power Tool XMLDBViewer. This allows me to connect to the XML table called Category where I can Edit, Delete or even create new Category's directly in the XML table.
Let me know if you have any additional questions about this.
-
-
Techniques that are used for creating data models in QlikView
Techniques that are used for creating data models in QlikView are as below:1) CONCATENATE2) JOIN3) MAPPINGConcatenate appends data from multiple data ... Show MoreTechniques that are used for creating data models in QlikView are as below:
1) CONCATENATE
2) JOIN
3) MAPPING
Concatenate appends data from multiple data tables
- Automatic
- Forced : Concatenate
- Prevent :NoConcatenate
Join is used for consolidating the data from multiple tables into a single table
- INNER
- LEFT
- RIGHT
- OUTER
Mapping consolidates the data from a single field into a table
QlikView will perform better in
- Denormalized data storage
- Star Schema
This is due to shorter chain structure.
Above techniques help moving data models from normalized/relational structure towards denormalized/Snowflake/Star schemas.
-
Maps - Using APIGoogle with slider of distance.qvw
Hi,I did an application where I show you about use of the APIGoogle Maps. I did a slider where you choice a distance for to find his regions and his c... Show MoreHi,
I did an application where I show you about use of the APIGoogle Maps. I did a slider where you choice a distance for to find his regions and his costomers. Very easy, but for me was very helpful. I hope it is helpful for you too!
Thanks!

-
HideChartProperties.qvw
Hi,I did an application where I show some actions that you could need in his Qlik applications. This application contains automation by macros writing... Show MoreHi,
I did an application where I show some actions that you could need in his Qlik applications. This application contains automation by macros writing in VB Script that allow changes in Chart such as font size, font color, also I can to hide legend, dimensions, values on data points etc.
I hope it is helpful!
-
How to change IE Browser Compatibility
Hi friends,Many of you faces the issue regarding the QlikView version compatibility with IE Browser. The issue can be resolved by changing the IE comp... Show MoreHi friends,
Many of you faces the issue regarding the QlikView version compatibility with IE Browser. The issue can be resolved by changing the IE compatibility Mode. This is the very easy document for everyone.
How to change the compatibility of the browser.
Giving you a example , if you are working with the QlikView 11.0 SR2, it is not compatible with IE-10 , so we need to change the compatibility of the browser before opening the document.


